
Page 18 - Read Online
P. 18
Castán et al. Radiology of hepatocarcinoma in non-cirrhotic patients
A A
B B
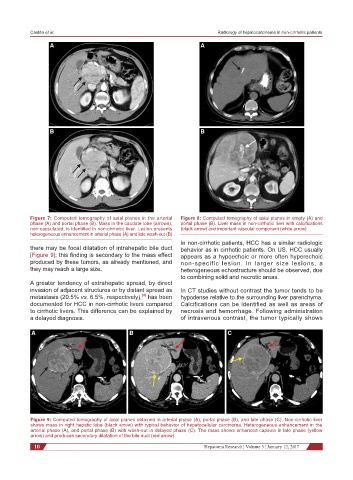
Figure 7: Computed tomography of axial planes in the arterial Figure 8: Computed tomography of axial planes in empty (A) and
phase (A) and portal phase (B). Mass in the caudate lobe (arrows), portal phase (B). Liver mass in non-cirrhotic liver with calcifications
non-capsulated, is identified in non-cirrhotic liver. Lesion presents (black arrow) and important vascular component (white arrow)
heterogeneous enhancement in arterial phase (A) and late wash-out (B)
In non-cirrhotic patients, HCC has a similar radiologic
there may be focal dilatation of intrahepatic bile duct behavior as in cirrhotic patients. On US, HCC usually
[Figure 9]; this finding is secondary to the mass effect appears as a hypoechoic or more often hyperechoic
produced by these tumors, as already mentioned, and non-specific lesion. In larger size lesions, a
they may reach a large size. heterogeneous echostructure should be observed, due
to combining solid and necrotic areas.
A greater tendency of extrahepatic spread, by direct
invasion of adjacent structures or by distant spread as In CT studies without contrast the tumor tends to be
[4]
metastasis (20.5% vs. 6.5%, respectively), has been hypodense relative to the surrounding liver parenchyma.
documented for HCC in non-cirrhotic livers compared Calcifications can be identified as well as areas of
to cirrhotic livers. This difference can be explained by necrosis and hemorrhage. Following administration
a delayed diagnosis. of intravenous contrast, the tumor typically shows
A B C
Figure 9: Computed tomography of axial planes obtained in arterial phase (A), portal phase (B), and late phase (C). Non-cirrhotic liver
shows mass in right hepatic lobe (black arrow) with typical behavior of hepatocellular carcinoma. Heterogeneous enhancement in the
arterial phase (A), and portal phase (B) with wash-out in delayed phase (C). The mass shows enhanced capsule in late phase (yellow
arrow) and produces secondary dilatation of the bile duct (red arrow)
10 Hepatoma Research ¦ Volume 3 ¦ January 12, 2017