
Page 15 - Read Online
P. 15
Castán et al. Radiology of hepatocarcinoma in non-cirrhotic patients
and the inter-observer variability make this a poor
criterion. In cases of severe portal hypertension there
may be reversal of flow in the main vein or intrahepatic
branches (centrifugal flow), and even thrombosis of
the portal vein and portal cavernoma. Other signs of
portal hypertension most commonly found in these
patients are the presence of ascites, splenomegaly and
porto-systemic collaterals (near the gastroesophageal
junction, paraumbilical, retroperitoneal, gastro or
spleno-renal and hemorrhoidal). However, conventional
US does not usually detect abnormalities in liver
morphology in patients with mild cirrhosis. The absence
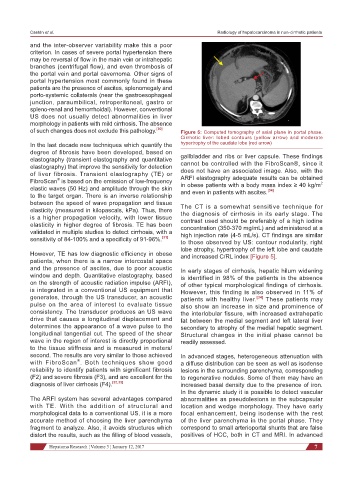
of such changes does not exclude this pathology. [30] Figure 5: Computed tomography of axial plane in portal phase.
Cirrhotic liver: lobed contours (yellow arrow) and moderate
In the last decade new techniques which quantify the hypertrophy of the caudate lobe (red arrow)
degree of fibrosis have been developed, based on
elastography (transient elastography and quantitative gallbladder and ribs or liver capsule. These findings
elastography) that improve the sensitivity for detection cannot be controlled with the FibroScan®, since it
of liver fibrosis. Transient elastography (TE) or does not have an associated image. Also, with the
FibroScan is based on the emission of low-frequency ARFI elastography adequate results can be obtained
®
2
elastic waves (50 Hz) and amplitude through the skin in obese patients with a body mass index ≥ 40 kg/m
[34]
and even in patients with ascites.
to the target organ. There is an inverse relationship
between the speed of wave propagation and tissue The CT is a somewhat sensitive technique for
elasticity (measured in kilopascals, kPa). Thus, there the diagnosis of cirrhosis in its early stage. The
is a higher propagation velocity, with lower tissue contrast used should be preferably of a high iodine
elasticity in higher degree of fibrosis. TE has been concentration (350-370 mg/mL) and administered at a
validated in multiple studies to detect cirrhosis, with a high injection rate (4-5 mL/s). CT findings are similar
sensitivity of 84-100% and a specificity of 91-96%. [31] to those observed by US: contour nodularity, right
lobe atrophy, hypertrophy of the left lobe and caudate
However, TE has low diagnostic efficiency in obese and increased C/RL index [Figure 5].
patients, when there is a narrow intercostal space
and the presence of ascites, due to poor acoustic In early stages of cirrhosis, hepatic hilum widening
window and depth. Quantitative elastography, based is identified in 98% of the patients in the absence
on the strength of acoustic radiation impulse (ARFI), of other typical morphological findings of cirrhosis.
is integrated in a conventional US equipment that However, this finding is also observed in 11% of
generates, through the US transducer, an acoustic patients with healthy liver. [34] These patients may
pulse on the area of interest to evaluate tissue also show an increase in size and prominence of
consistency. The transducer produces an US wave the interlobular fissure, with increased extrahepatic
drive that causes a longitudinal displacement and fat between the medial segment and left lateral liver
determines the appearance of a wave pulse to the secondary to atrophy of the medial hepatic segment.
longitudinal tangential cut. The speed of the shear Structural changes in the initial phase cannot be
wave in the region of interest is directly proportional readily assessed.
to the tissue stiffness and is measured in meters/
second. The results are very similar to those achieved In advanced stages, heterogeneous attenuation with
with FibroScan . Both techniques show good a diffuse distribution can be seen as well as isodense
®
reliability to identify patients with significant fibrosis lesions in the surrounding parenchyma, corresponding
(F2) and severe fibrosis (F3), and are excellent for the to regenerative nodules. Some of them may have an
diagnosis of liver cirrhosis (F4). [32,33] increased basal density due to the presence of iron.
In the dynamic study it is possible to detect vascular
The ARFI system has several advantages compared abnormalities as pseudolesions in the subcapsular
with TE. With the addition of structural and location and wedge morphology. They have early
morphological data to a conventional US, it is a more focal enhancement, being isodense with the rest
accurate method of choosing the liver parenchyma of the liver parenchyma in the portal phase. They
fragment to analyze. Also, it avoids structures which correspond to small arterioportal shunts that are false
distort the results, such as the filling of blood vessels, positives of HCC, both in CT and MRI. In advanced
Hepatoma Research ¦ Volume 3 ¦ January 12, 2017 7