


Page 68 - Read Online
P. 68
Page 10 of 20                    Han et al. Carbon Footprints 2025, 4, 25  https://dx.doi.org/10.20517/cf.2025.18


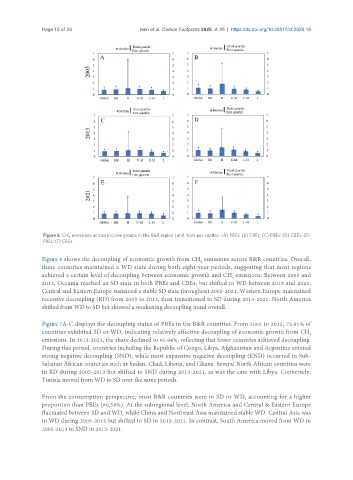
                Figure 5. CH  emissions across income groups in the B&R region (unit: tons per capita). (A) PBEs; (B) CBEs; (C) PBEs; (D) CBEs; (E)
                        4
                PBEs; (F) CBEs.

               Figure 6 shows the decoupling of economic growth from CH  emissions across B&R countries. Overall,
                                                                     4
               these countries maintained a WD state during both eight-year periods, suggesting that most regions
               achieved a certain level of decoupling between economic growth and CH  emissions. Between 2005 and
                                                                               4
               2013, Oceania reached an SD state in both PBEs and CBEs, but shifted to WD between 2013 and 2021.
               Central and Eastern Europe sustained a stable SD state throughout 2005-2021. Western Europe maintained
               recessive decoupling (RD) from 2005 to 2013, then transitioned to SD during 2013-2021. North America
               shifted from WD to SD but showed a weakening decoupling trend overall.

               Figure 7A-C displays the decoupling status of PBEs in the B&R countries. From 2005 to 2013, 73.91% of
               countries exhibited SD or WD, indicating relatively effective decoupling of economic growth from CH
                                                                                                         4
               emissions. In 2013-2021, the share declined to 65.94%, reflecting that fewer countries achieved decoupling.
               During this period, countries including the Republic of Congo, Libya, Afghanistan and Argentina entered
               strong negative decoupling (SND), while most expansive negative decoupling (END) occurred in Sub-
               Saharan African countries such as Sudan, Chad, Liberia, and Ghana. Several North African countries were
               in RD during 2005-2013 but shifted to SND during 2013-2021, as was the case with Libya. Conversely,
               Tunisia moved from WD to SD over the same periods.


               From the consumption perspective, most B&R countries were in SD or WD, accounting for a higher
               proportion than PBEs (80.58%). At the subregional level, North America and Central & Eastern Europe
               fluctuated between SD and WD, while China and Northeast Asia maintained stable WD. Central Asia was
               in WD during 2005-2013 but shifted to SD in 2013-2021. In contrast, South America moved from WD in
               2005-2013 to SND in 2013-2021.

