


Page 67 - Read Online
P. 67
Han et al. Carbon Footprints 2025, 4, 25  https://dx.doi.org/10.20517/cf.2025.18  Page 9 of 20


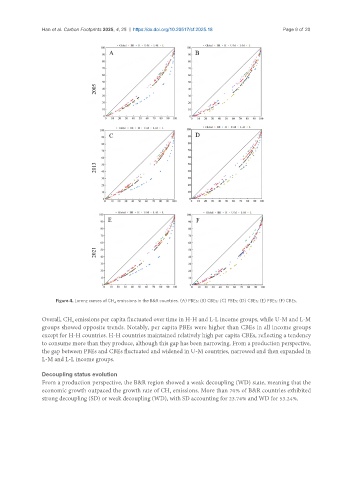
                    Figure 4. Lorenz curves of CH  emissions in the B&R countries. (A) PBEs; (B) CBEs; (C) PBEs; (D) CBEs; (E) PBEs; (F) CBEs.
                                        4
               Overall, CH  emissions per capita fluctuated over time in H-H and L-L income groups, while U-M and L-M
                         4
               groups showed opposite trends. Notably, per capita PBEs were higher than CBEs in all income groups
               except for H-H countries. H-H countries maintained relatively high per capita CBEs, reflecting a tendency
               to consume more than they produce, although this gap has been narrowing. From a production perspective,
               the gap between PBEs and CBEs fluctuated and widened in U-M countries, narrowed and then expanded in
               L-M and L-L income groups.

               Decoupling status evolution
               From a production perspective, the B&R region showed a weak decoupling (WD) state, meaning that the
               economic growth outpaced the growth rate of CH  emissions. More than 70% of B&R countries exhibited
                                                          4
               strong decoupling (SD) or weak decoupling (WD), with SD accounting for 23.74% and WD for 53.24%.

