


Page 71 - Read Online
P. 71
Han et al. Carbon Footprints 2025, 4, 25  https://dx.doi.org/10.20517/cf.2025.18  Page 13 of 20


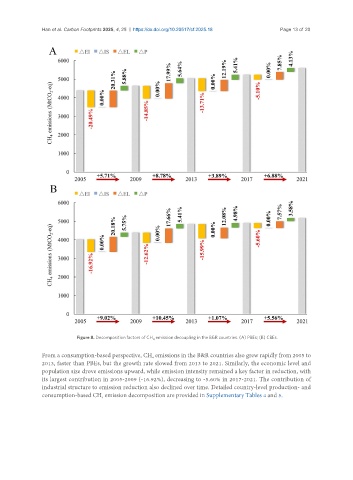
                           Figure 8. Decomposition factors of CH  emission decoupling in the B&R countries. (A) PBEs; (B) CBEs.
                                                     4
               From a consumption-based perspective, CH  emissions in the B&R countries also grew rapidly from 2005 to
                                                    4
               2013, faster than PBEs, but the growth rate slowed from 2013 to 2021. Similarly, the economic level and
               population size drove emissions upward, while emission intensity remained a key factor in reduction, with
               its largest contribution in 2005-2009 (-16.92%), decreasing to -5.60% in 2017-2021. The contribution of
               industrial structure to emission reduction also declined over time. Detailed country-level production- and
               consumption-based CH  emission decomposition are provided in Supplementary Tables 4 and 5.
                                   4

