


Page 73 - Read Online
P. 73
Han et al. Carbon Footprints 2025, 4, 25  https://dx.doi.org/10.20517/cf.2025.18  Page 15 of 20

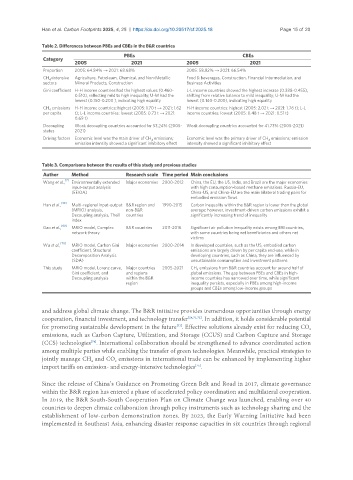
               Table 2. Differences between PBEs and CBEs in the B&R countries
                                           PBEs                                    CBEs
                Category
                          2005               2021               2005                 2021
                Proportion  2005: 64.84% → 2021: 68.68%         2005: 58.82% → 2021: 66.54%
                CH -intensive   Agriculture, Petroleum, Chemical, and Non-Metallic   Food & beverages, Construction, Financial Intermediation, and
                  4
                sectors   Mineral Products, Construction        Business Activities
                Gini coefficient H-H income countries had the highest values (0.460-  L-L income countries showed the highest increase (0.388-0.455),
                          0.510), reflecting mild to high inequality; U-M had the   shifting from relative balance to mild inequality; U-M had the
                          lowest (0.150-0.200 ), indicating high equality  lowest (0.140-0.200), indicating high equality
                CH  emissions  H-H income countries: highest (2005: 1.70 t → 2021: 1.62  H-H income countries: highest (2005: 2.02 t → 2021: 1.76 t); L-L
                  4
                per capita  t); L-L income countries: lowest (2005: 0.73 t → 2021:   income countries: lowest (2005: 0.48 t → 2021: 0.51 t)
                          0.69 t)
                Decoupling   Weak decoupling countries accounted for 53.24% (2005-  Weak decoupling countries accounted for 41.73% (2005-2021)
                status    2021)
                Driving factors  Economic level was the main driver of CH  emissions;   Economic level was the primary driver of CH  emissions; emission
                                                    4
                                                                                            4
                          emission intensity showed a significant inhibitory effect  intensity showed a significant inhibitory effect
               Table 3. Comparisons between the results of this study and previous studies
                Author   Method             Research scale Time period Main conclusions
                       [7]
                Wang et al.,  Environmentally extended   Major economies 2000-2012  China, the EU, the US, India, and Brazil are the major economies
                         input-output analysis                   with high consumption-based methane emissions. Russia-EU,
                         (EEIOA)                                 China-US, and China-EU are the main bilateral trading pairs for
                                                                 embodied emission flows
                      [39]
                Han et al.,  Multi-regional input-output  B&R region and   1990-2015  Carbon inequality within the B&R region is lower than the global
                         (MRIO) analysis,   non-B&R              average; however, investment-driven carbon emissions exhibit a
                         Decoupling analysis, Theil   countries  significantly increasing trend of inequality
                         index
                Gao et al., [69]  MRIO model, Complex   B&R countries  2011-2016  Significant air pollution inequality exists among BRI countries,
                         network theory                          with some countries being net beneficiaries and others net
                                                                 victims
                     [70]
                Wu et al.,  MRIO model, Carbon Gini   Major economies 2000-2014  In developed countries, such as the US, embodied carbon
                         coefficient, Structural                 emissions are largely driven by per capita end-use, while in
                         Decomposition Analysis                  developing countries, such as China, they are influenced by
                         (SDA)                                   unsustainable consumption and investment patterns
                This study  MRIO model, Lorenz curve,  Major countries   2005-2021  CH  emissions from B&R countries account for around half of
                                                                   4
                         Gini coefficient, and   and regions     global emissions. The gap between PBEs and CBEs in high-
                         Decoupling analysis  within the B&R     income countries has narrowed over time, while significant
                                            region               inequality persists, especially in PBEs among high-income
                                                                 groups and CBEs among low-income groups


               and address global climate change. The B&R initiative provides tremendous opportunities through energy
               cooperation, financial investment, and technology transfer [24,71,72] . In addition, it holds considerable potential
                                                             [73]
               for promoting sustainable development in the future . Effective solutions already exist for reducing CO
                                                                                                         2
               emissions, such as Carbon Capture, Utilization, and Storage (CCUS) and Carbon Capture and Storage
                                [74]
               (CCS) technologies . International collaboration should be strengthened to advance coordinated action
               among multiple parties while enabling the transfer of green technologies. Meanwhile, practical strategies to
               jointly manage CH  and CO  emissions in international trade can be enhanced by implementing higher
                                4
                                        2
                                                                   [75]
               import tariffs on emission- and energy-intensive technologies .
               Since the release of China’s Guidance on Promoting Green Belt and Road in 2017, climate governance
               within the B&R region has entered a phase of accelerated policy coordination and multilateral cooperation.
               In 2019, the B&R South-South Cooperation Plan on Climate Change was launched, enabling over 40
               countries to deepen climate collaboration through policy instruments such as technology sharing and the
               establishment of low-carbon demonstration zones. By 2023, the Early Warning Initiative had been
               implemented in Southeast Asia, enhancing disaster response capacities in six countries through regional

