


Page 70 - Read Online
P. 70
Page 12 of 20                    Han et al. Carbon Footprints 2025, 4, 25  https://dx.doi.org/10.20517/cf.2025.18

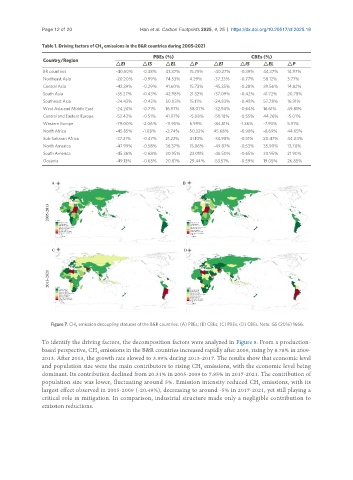
               Table 1. Driving factors of CH  emissions in the B&R countries during 2005-2021
                                   4
                                                     PBEs (%)                         CBEs (%)
                Country/Region
                                        △EI      △IS     △EL     △P      △EI      △IS     △EL     △P
                BR countries            -40.50%  -0.38%  43.37%  15.75%  -40.27%  -0.39%  44.37%  14.97%
                Northeast Asia          -20.20%  -0.99%  74.53%  4.29%   -37.33%  -0.77%  58.12%  3.77%
                Central Asia            -42.39%  -0.29%  41.60%  15.73%  -45.35%  -0.28%  39.56%  14.82%
                South Asia              -35.27%  -0.43%  42.98%  21.32%  -37.09%  -0.42%  41.72%  20.78%
                Southeast Asia          -34.43%  -0.43%  50.03%  15.11%  -24.83%  -0.48%  57.78%  16.91%
                West Asia and Middle East  -24.24%  -0.71%  16.97%  58.07%  -32.94%  -0.64%  16.61%  49.81%
                Central and Eastern Europe  -52.43%  -0.51%  41.97%  -5.08%  -50.18%  -0.55%  44.26%  -5.01%
                Western Europe          -79.00%  -2.06%  -11.95%  6.99%  -84.81%  -1.36%  -7.93%  5.91%
                North Africa            -45.85%  -1.08%  -2.74%  50.32%  45.68%   -0.98%  -8.69%  44.65%
                Sub-Saharan Africa      -37.21%  -0.47%  21.22%  41.10%  -34.98%  -0.51%  20.47%  44.04%
                North America           -47.99%  -0.58%  36.37%  15.06%  -49.87%  -0.53%  35.90%  13.70%
                South America           -45.36%  -0.68%  30.95%  23.01%  -46.50%  -0.65%  30.95%  21.90%
                Oceania                 -49.13%  -0.63%  20.81%  29.44%  -53.51%  -0.59%  19.05%  26.85%


                  Figure 7. CH  emission decoupling statuses of the B&R countries. (A) PBEs; (B) CBEs; (C) PBEs; (D) CBEs. Note: GS (2016) 1666.
                           4
               To identify the driving factors, the decomposition factors were analyzed in Figure 8. From a production-
               based perspective, CH  emissions in the B&R countries increased rapidly after 2009, rising by 8.78% in 2009-
                                  4
               2013. After 2013, the growth rate slowed to 3.89% during 2013-2017. The results show that economic level
               and population size were the main contributors to rising CH  emissions, with the economic level being
                                                                     4
               dominant. Its contribution declined from 20.31% in 2005-2009 to 7.85% in 2017-2021. The contribution of
               population size was lower, fluctuating around 5%. Emission intensity reduced CH  emissions, with its
                                                                                        4
               largest effect observed in 2005-2009 (-20.49%), decreasing to around -5% in 2017-2021, yet still playing a
               critical role in mitigation. In comparison, industrial structure made only a negligible contribution to
               emission reductions.

