


Page 65 - Read Online
P. 65
Han et al. Carbon Footprints 2025, 4, 25  https://dx.doi.org/10.20517/cf.2025.18  Page 7 of 20


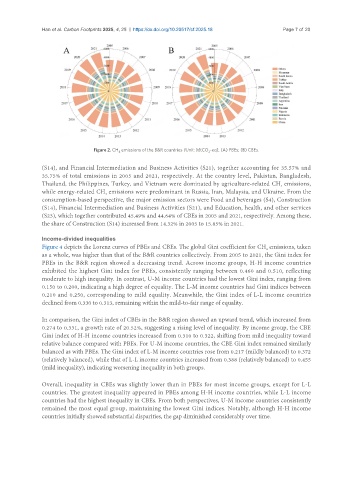
                                 Figure 2. CH  emissions of the B&R countries (Unit: MtCO -eq), (A) PBEs; (B) CBEs.
                                                                       2
                                         4
               (S14), and Financial Intermediation and Business Activities (S21), together accounting for 35.57% and
               35.75% of total emissions in 2005 and 2021, respectively. At the country level, Pakistan, Bangladesh,
               Thailand, the Philippines, Turkey, and Vietnam were dominated by agriculture-related CH  emissions,
                                                                                                4
               while energy-related CH  emissions were predominant in Russia, Iran, Malaysia, and Ukraine. From the
                                    4
               consumption-based perspective, the major emission sectors were Food and beverages (S4), Construction
               (S14), Financial Intermediation and Business Activities (S21), and Education, health, and other services
               (S23), which together contributed 45.49% and 44.64% of CBEs in 2005 and 2021, respectively. Among these,
               the share of Construction (S14) increased from 14.32% in 2005 to 15.85% in 2021.


               Income-divided inequalities
               Figure 4 depicts the Lorenz curves of PBEs and CBEs. The global Gini coefficient for CH  emissions, taken
                                                                                           4
               as a whole, was higher than that of the B&R countries collectively. From 2005 to 2021, the Gini index for
               PBEs in the B&R region showed a decreasing trend. Across income groups, H-H income countries
               exhibited the highest Gini index for PBEs, consistently ranging between 0.460 and 0.510, reflecting
               moderate to high inequality. In contrast, U-M income countries had the lowest Gini index, ranging from
               0.150 to 0.200, indicating a high degree of equality. The L-M income countries had Gini indices between
               0.210 and 0.250, corresponding to mild equality. Meanwhile, the Gini index of L-L income countries
               declined from 0.330 to 0.313, remaining within the mild-to-fair range of equality.

               In comparison, the Gini index of CBEs in the B&R region showed an upward trend, which increased from
               0.274 to 0.331, a growth rate of 20.52%, suggesting a rising level of inequality. By income group, the CBE
               Gini index of H-H income countries increased from 0.310 to 0.322, shifting from mild inequality toward
               relative balance compared with PBEs. For U-M income countries, the CBE Gini index remained similarly
               balanced as with PBEs. The Gini index of L-M income countries rose from 0.217 (mildly balanced) to 0.372
               (relatively balanced), while that of L-L income countries increased from 0.388 (relatively balanced) to 0.455
               (mild inequality), indicating worsening inequality in both groups.


               Overall, inequality in CBEs was slightly lower than in PBEs for most income groups, except for L-L
               countries. The greatest inequality appeared in PBEs among H-H income countries, while L-L income
               countries had the highest inequality in CBEs. From both perspectives, U-M income countries consistently
               remained the most equal group, maintaining the lowest Gini indices. Notably, although H-H income
               countries initially showed substantial disparities, the gap diminished considerably over time.

