


Page 63 - Read Online
P. 63
Han et al. Carbon Footprints 2025, 4, 25  https://dx.doi.org/10.20517/cf.2025.18  Page 5 of 20


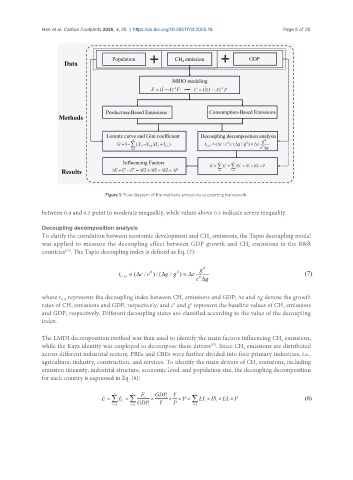
                                     Figure 1. Flow diagram of the methane emissions accounting framework.

               between 0.4 and 0.5 point to moderate inequality, while values above 0.5 indicate severe inequality.


               Decoupling decomposition analysis
               To clarify the correlation between economic development and CH  emissions, the Tapio decoupling model
                                                                       4
               was applied to measure the decoupling effect between GDP growth and CH  emissions in the B&R
                                                                                     4
               countries . The Tapio decoupling index is defined as Eq. (7):
                       [39]


               where t  represents the decoupling index between CH  emissions and GDP, Δc and Δg denote the growth
                      C,G
                                                              4
               rates of CH  emissions and GDP, respectively, and c  and g  represent the baseline values of CH  emissions
                                                           0
                                                                 0
                         4
                                                                                                4
               and GDP, respectively. Different decoupling states are classified according to the value of the decoupling
               index.
               The LMDI decomposition method was then used to identify the main factors influencing CH  emissions,
                                                                                                4
               while the Kaya identity was employed to decompose these drivers . Since CH  emissions are distributed
                                                                        [57]
                                                                                   4
               across different industrial sectors, PBEs and CBEs were further divided into four primary industries, i.e.,
               agriculture, industry, construction, and services. To identify the main drivers of CH  emissions, including
                                                                                       4
               emission intensity, industrial structure, economic level, and population size, the decoupling decomposition
               for each country is expressed in Eq. (8):

