


Page 64 - Read Online
P. 64
Page 6 of 20                     Han et al. Carbon Footprints 2025, 4, 25  https://dx.doi.org/10.20517/cf.2025.18

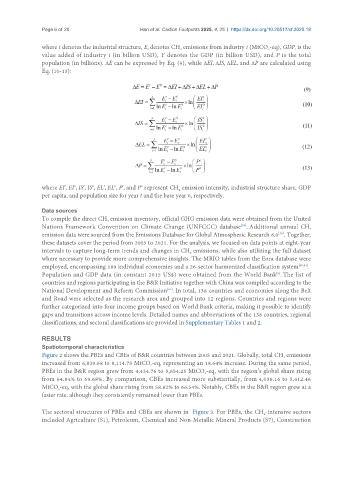
               where i denotes the industrial structure, E denotes CH  emissions from industry i (MtCO -eq), GDP is the
                                                                                           2
                                                                                                    i
                                                              4
                                                   i
               value added of industry i (in billion USD), Y denotes the GDP (in billion USD), and P is the total
               population (in billions). ΔE can be expressed by Eq. (9), while ΔEI, ΔIS, ΔEL, and ΔP are calculated using
               Eq. (10-13):


               where EI, EI , IS, IS , EL, EL , P, and P  represent CH  emission intensity, industrial structure share, GDP
                                        0
                                                 0
                                          t
                                0
                                    t
                             t
                       t
                          0
                                                             4
               per capita, and population size for year t and the base year 0, respectively.
               Data sources
               To compile the direct CH  emission inventory, official GHG emission data were obtained from the United
                                     4
                                                                                  [58]
               Nations Framework Convention on Climate Change (UNFCCC) database . Additional annual CH
                                                                                                         4
               emission data were sourced from the Emissions Database for Global Atmospheric Research 6.0 . Together,
                                                                                               [59]
               these datasets cover the period from 2005 to 2021. For the analysis, we focused on data points at eight-year
               intervals to capture long-term trends and changes in CH  emissions, while also utilizing the full dataset
                                                                 4
               where necessary to provide more comprehensive insights. The MRIO tables from the Eora database were
               employed, encompassing 189 individual economies and a 26-sector harmonized classification system [60,61] .
               Population and GDP data (in constant 2015 US$) were obtained from the World Bank . The list of
                                                                                              [9]
               countries and regions participating in the B&R Initiative together with China was compiled according to the
               National Development and Reform Commission . In total, 138 countries and economies along the Belt
                                                         [62]
               and Road were selected as the research area and grouped into 12 regions. Countries and regions were
               further categorized into four income groups based on World Bank criteria, making it possible to identify
               gaps and transitions across income levels. Detailed names and abbreviations of the 138 countries, regional
               classifications, and sectoral classifications are provided in Supplementary Tables 1 and 2.
               RESULTS
               Spatiotemporal characteristics
               Figure 2 shows the PBEs and CBEs of B&R countries between 2005 and 2021. Globally, total CH  emissions
                                                                                                 4
               increased from 6,839.68 to 8,114.75 MtCO -eq, representing an 18.64% increase. During the same period,
                                                    2
               PBEs in the B&R region grew from 4,434.76 to 5,654.25 MtCO -eq, with the region’s global share rising
                                                                      2
               from 64.84% to 69.68%. By comparison, CBEs increased more substantially, from 4,036.16 to 5,412.46
               MtCO -eq, with the global share rising from 58.82% to 66.54%. Notably, CBEs in the B&R region grew at a
                     2
               faster rate, although they consistently remained lower than PBEs.

               The sectoral structures of PBEs and CBEs are shown in  Figure 3. For PBEs, the CH -intensive sectors
                                                                                          4
               included Agriculture (S1), Petroleum, Chemical and Non-Metallic Mineral Products (S7), Construction

