


Page 62 - Read Online
P. 62
Page 4 of 20                     Han et al. Carbon Footprints 2025, 4, 25  https://dx.doi.org/10.20517/cf.2025.18


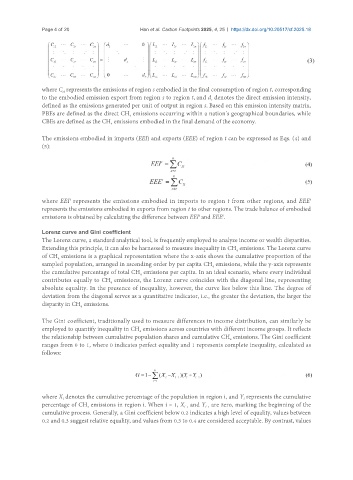
               where C  represents the emissions of region s embodied in the final consumption of region t, corresponding
                      st
               to the embodied emission export from region s to region t, and d  denotes the direct emission intensity,
                                                                        s
               defined as the emissions generated per unit of output in region s. Based on this emission intensity matrix,
               PBEs are defined as the direct CH  emissions occurring within a nation’s geographical boundaries, while
                                             4
               CBEs are defined as the CH  emissions embodied in the final demand of the economy.
                                      4
               The emissions embodied in imports (EEI) and exports (EEE) of region t can be expressed as Eqs. (4) and
               (5):


                         t
               where EEI  represents the emissions embodied in imports to region t from other regions, and EEE
                                                                                                         t
               represents the emissions embodied in exports from region t to other regions. The trade balance of embodied
               emissions is obtained by calculating the difference between EEI and EEE. t
                                                                    t
               Lorenz curve and Gini coefficient
               The Lorenz curve, a standard analytical tool, is frequently employed to analyze income or wealth disparities.
               Extending this principle, it can also be harnessed to measure inequality in CH  emissions. The Lorenz curve
                                                                                 4
               of CH  emissions is a graphical representation where the x-axis shows the cumulative proportion of the
                     4
               sampled population, arranged in ascending order by per capita CH  emissions, while the y-axis represents
                                                                         4
               the cumulative percentage of total CH  emissions per capita. In an ideal scenario, where every individual
                                                4
               contributes equally to CH  emissions, the Lorenz curve coincides with the diagonal line, representing
                                      4
               absolute equality. In the presence of inequality, however, the curve lies below this line. The degree of
               deviation from the diagonal serves as a quantitative indicator, i.e., the greater the deviation, the larger the
               disparity in CH  emissions.
                            4

               The Gini coefficient, traditionally used to measure differences in income distribution, can similarly be
               employed to quantify inequality in CH  emissions across countries with different income groups. It reflects
                                                4
               the relationship between cumulative population shares and cumulative CH  emissions. The Gini coefficient
                                                                               4
               ranges from 0 to 1, where 0 indicates perfect equality and 1 represents complete inequality, calculated as
               follows:


               where X denotes the cumulative percentage of the population in region i, and Y represents the cumulative
                                                                                   i
                      i
               percentage of CH  emissions in region i. When i = 1, X  and Y  are zero, marking the beginning of the
                              4
                                                               i-1
                                                                      i-1
               cumulative process. Generally, a Gini coefficient below 0.2 indicates a high level of equality, values between
               0.2 and 0.3 suggest relative equality, and values from 0.3 to 0.4 are considered acceptable. By contrast, values

