


Page 66 - Read Online
P. 66
Page 8 of 20                     Han et al. Carbon Footprints 2025, 4, 25  https://dx.doi.org/10.20517/cf.2025.18


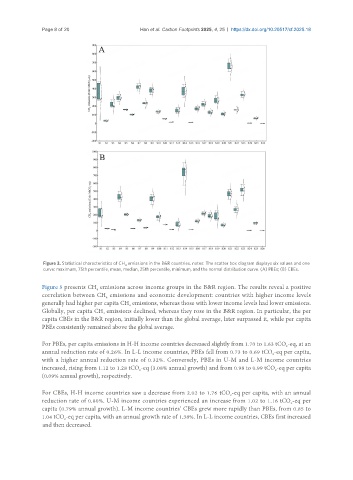
                Figure 3. Statistical characteristics of CH  emissions in the B&R countries. notes: The scatter box diagram displays six values and one
                                           4
                curve: maximum, 75th percentile, mean, median, 25th percentile, minimum, and the normal distribution curve. (A) PBEs; (B) CBEs.

               Figure 5 presents CH  emissions across income groups in the B&R region. The results reveal a positive
                                  4
               correlation between CH  emissions and economic development: countries with higher income levels
                                     4
               generally had higher per capita CH  emissions, whereas those with lower income levels had lower emissions.
                                             4
               Globally, per capita CH  emissions declined, whereas they rose in the B&R region. In particular, the per
                                    4
               capita CBEs in the B&R region, initially lower than the global average, later surpassed it, while per capita
               PBEs consistently remained above the global average.

               For PBEs, per capita emissions in H-H income countries decreased slightly from 1.70 to 1.63 tCO -eq, at an
                                                                                                 2
               annual reduction rate of 0.26%. In L-L income countries, PBEs fell from 0.73 to 0.69 tCO -eq per capita,
                                                                                             2
               with a higher annual reduction rate of 0.32%. Conversely, PBEs in U-M and L-M income countries
               increased, rising from 1.12 to 1.28 tCO -eq (3.08% annual growth) and from 0.98 to 0.99 tCO -eq per capita
                                                2
                                                                                              2
               (0.09% annual growth), respectively.
               For CBEs, H-H income countries saw a decrease from 2.02 to 1.76 tCO -eq per capita, with an annual
                                                                               2
               reduction rate of 0.80%. U-M income countries experienced an increase from 1.02 to 1.16 tCO -eq per
                                                                                                   2
               capita (0.79% annual growth). L-M income countries’ CBEs grew more rapidly than PBEs, from 0.85 to
               1.04 tCO -eq per capita, with an annual growth rate of 1.38%. In L-L income countries, CBEs first increased
                       2
               and then decreased.

