
Page 104 - Read Online
P. 104
Page 10 of 19 Wan et al. Microstructures 2023;3:2023014 https://dx.doi.org/10.20517/microstructures.2022.36
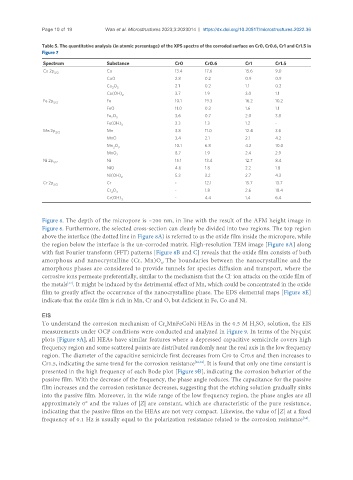
Table 5. The quantitative analysis (in atomic percentage) of the XPS spectra of the corroded surface on Cr0, Cr0.6, Cr1 and Cr1.5 in
Figure 7
Spectrum Substance Cr0 Cr0.6 Cr1 Cr1.5
Co 2p 3/2 Co 13.4 17.6 15.6 9.0
CoO 2.8 0.2 0.9 0.9
Co O 3 2.1 0.2 1.1 0.2
2
Co(OH) 2 3.7 1.9 3.0 1.1
Fe 2p 3/2 Fe 10.1 19.3 16.2 10.2
FeO 11.0 0.3 1.6 1.1
Fe O 3.6 0.7 2.0 3.8
2 3
Fe(OH) 3 2.3 1.3 1.2 -
Mn 2p Mn 3.8 11.0 12.4 3.6
3/2
MnO 3.4 2.1 2.1 4.2
Mn O 10.1 6.8 4.2 10.0
2 3
MnO 2 8.7 1.9 2.4 2.9
Ni 2p Ni 15.1 13.4 12.7 8.4
3/2
NiO 4.6 1.8 2.2 1.8
Ni(OH) 2 5.3 3.2 2.7 4.3
Cr 2p 3/2 Cr - 12.1 15.7 13.7
Cr O 3 - 1.8 2.6 18.4
2
Cr(OH) - 4.4 1.4 6.4
3
Figure 8. The depth of the micropore is ~200 nm, in line with the result of the AFM height image in
Figure 6. Furthermore, the selected cross-section can clearly be divided into two regions. The top region
above the interface (the dotted line in Figure 8A) is referred to as the oxide film inside the micropore, while
the region below the interface is the un-corroded matrix. High-resolution TEM image [Figure 8A] along
with fast Fourier transform (FFT) patterns [Figure 8B and C] reveals that the oxide film consists of both
amorphous and nanocrystalline (Cr, Mn)O . The boundaries between the nanocrystalline and the
x
amorphous phases are considered to provide tunnels for species diffusion and transport, where the
corrosive ions permeate preferentially, similar to the mechanism that the Cl ion attacks on the oxide film of
-
the metals . It might be induced by the detrimental effect of Mn, which could be concentrated in the oxide
[32]
film to greatly affect the occurrence of the nanocrystalline phase. The EDS elemental maps [Figure 8E]
indicate that the oxide film is rich in Mn, Cr and O, but deficient in Fe, Co and Ni.
EIS
To understand the corrosion mechanism of Cr MnFeCoNi HEAs in the 0.5 M H SO solution, the EIS
x
4
2
measurements under OCP conditions were conducted and analyzed in Figure 9. In terms of the Nyquist
plots [Figure 9A], all HEAs have similar features where a depressed capacitive semicircle covers high
frequency region and some scattered points are distributed randomly near the real axis in the low frequency
region. The diameter of the capacitive semicircle first decreases from Cr0 to Cr0.6 and then increases to
Cr1.5, indicating the same trend for the corrosion resistance [22,33] . It is found that only one time constant is
presented in the high frequency of each Bode plot [Figure 9B], indicating the corrosion behavior of the
passive film. With the decrease of the frequency, the phase angle reduces. The capacitance for the passive
film increases and the corrosion resistance decreases, suggesting that the etching solution gradually sinks
into the passive film. Moreover, in the wide range of the low frequency region, the phase angles are all
approximately 0° and the values of |Z| are constant, which are characteristic of the pure resistance,
indicating that the passive films on the HEAs are not very compact. Likewise, the value of |Z| at a fixed
frequency of 0.1 Hz is usually equal to the polarization resistance related to the corrosion resistance .
[34]