
Page 100 - Read Online
P. 100
Page 6 of 19 Wan et al. Microstructures 2023;3:2023014 https://dx.doi.org/10.20517/microstructures.2022.36
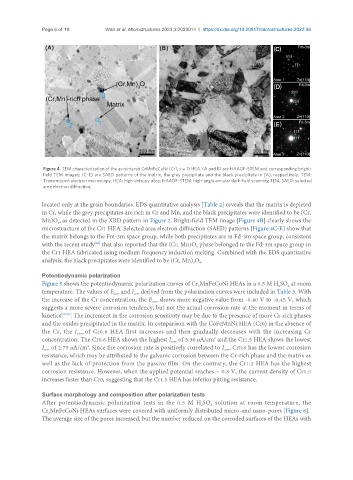
Figure 4. TEM characterization of the as-sintered CrMnFeCoNi (Cr1, x = 1) HEA. (A and B) are HAADF-STEM and corresponding bright-
field TEM images; (C-E) are SAED patterns of the matrix, the grey precipitate and the black precipitate in (A), respectively. TEM:
Transmission electron microscopy; HEA: high-entropy alloy; HAADF-STEM: high-angle annular dark-field scanning TEM; SAED: selected
area electron diffraction.
located only at the grain boundaries. EDS quantitative analysis [Table 2] reveals that the matrix is depleted
in Cr, while the grey precipitates are rich in Cr and Mn, and the black precipitates were identified to be (Cr,
Mn)O , as detected in the XRD pattern in Figure 2. Bright-field TEM image [Figure 4B] clearly shows the
x
microstructure of the Cr1 HEA. Selected area electron diffraction (SAED) patterns [Figure 4C-E] show that
the matrix belongs to the Fm-3m space group, while both precipitates are in Fd-3m space group, consistent
with the recent study that also reported that the (Cr, Mn)O phase belonged to the Fd-3m space group in
[26]
x
the Cr1 HEA fabricated using medium frequency induction melting. Combined with the EDS quantitative
analysis, the black precipitates were identified to be (Cr, Mn) O .
3
4
Potentiodynamic polarization
Figure 5 shows the potentiodynamic polarization curves of Cr MnFeCoNi HEAs in a 0.5 M H SO at room
x
4
2
temperature. The values of E and I derived from the polarization curves were included in Table 3. With
corr
corr
the increase of the Cr concentration, the E shows more negative value from -0.40 V to -0.45 V, which
corr
suggests a more severe corrosion tendency, but not the actual corrosion rate at the moment in terms of
kinetics [27,28] . The increment in the corrosion sensitivity may be due to the presence of more Cr-rich phases
and the oxides precipitated in the matrix. In comparison with the CoFeMnNi HEA (Cr0) in the absence of
the Cr, the I corr of Cr0.6 HEA first increases and then gradually decreases with the increasing Cr
2
concentration. The Cr0.6 HEA shows the highest I of 5.36 μA/cm and the Cr1.5 HEA shows the lowest
corr
I of 2.75 μA/cm . Since the corrosion rate is positively correlated to I , Cr0.6 has the lowest corrosion
2
corr
corr
resistance, which may be attributed to the galvanic corrosion between the Cr-rich phase and the matrix as
well as the lack of protection from the passive film. On the contrary, the Cr1.5 HEA has the highest
corrosion resistance. However, when the applied potential reaches ~ 0.8 V, the current density of Cr1.5
increases faster than Cr0, suggesting that the Cr1.5 HEA has inferior pitting resistance.
Surface morphology and composition after polarization tests
After potentiodynamic polarization tests in the 0.5 M H SO solution at room temperature, the
4
2
Cr MnFeCoNi HEAs surfaces were covered with uniformly distributed micro-and nano-pores [Figure 6].
x
The average size of the pores increased, but the number reduced on the corroded surfaces of the HEAs with