
Page 98 - Read Online
P. 98
Page 4 of 19 Wan et al. Microstructures 2023;3:2023014 https://dx.doi.org/10.20517/microstructures.2022.36
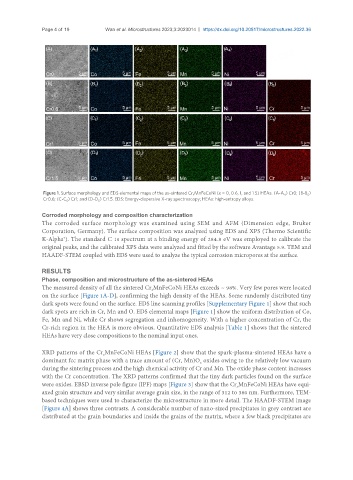
Figure 1. Surface morphology and EDS elemental maps of the as-sintered Cr xMnFeCoNi (x = 0, 0.6, 1, and 1.5) HEAs. (A-A ) Cr0; (B-B )
4 5
Cr0.6; (C-C ) Cr1; and (D-D ) Cr1.5. EDS: Energy-dispersive X-ray spectroscopy; HEAs: high-entropy alloys.
5
5
Corroded morphology and composition characterization
The corroded surface morphology was examined using SEM and AFM (Dimension edge, Bruker
Corporation, Germany). The surface composition was analyzed using EDS and XPS (Thermo Scientific
K-Alpha ). The standard C 1s spectrum at a binding energy of 284.8 eV was employed to calibrate the
+
original peaks, and the calibrated XPS data were analyzed and fitted by the software Avantage 5.9. TEM and
HAADF-STEM coupled with EDS were used to analyze the typical corrosion micropores at the surface.
RESULTS
Phase, composition and microstructure of the as-sintered HEAs
The measured density of all the sintered Cr MnFeCoNi HEAs exceeds ~ 98%. Very few pores were located
x
on the surface [Figure 1A-D], confirming the high density of the HEAs. Some randomly distributed tiny
dark spots were found on the surface. EDS line scanning profiles [Supplementary Figure 1] show that such
dark spots are rich in Cr, Mn and O. EDS elemental maps [Figure 1] show the uniform distribution of Co,
Fe, Mn and Ni, while Cr shows segregation and inhomogeneity. With a higher concentration of Cr, the
Cr-rich region in the HEA is more obvious. Quantitative EDS analysis [Table 1] shows that the sintered
HEAs have very close compositions to the nominal input ones.
XRD patterns of the Cr MnFeCoNi HEAs [Figure 2] show that the spark-plasma-sintered HEAs have a
x
dominant fcc matrix phase with a trace amount of (Cr, Mn)O oxides owing to the relatively low vacuum
x
during the sintering process and the high chemical activity of Cr and Mn. The oxide phase content increases
with the Cr concentration. The XRD patterns confirmed that the tiny dark particles found on the surface
were oxides. EBSD inverse pole figure (IPF) maps [Figure 3] show that the Cr MnFeCoNi HEAs have equi-
x
axed grain structure and very similar average grain size, in the range of 312 to 360 nm. Furthermore, TEM-
based techniques were used to characterize the microstructure in more detail. The HAADF-STEM image
[Figure 4A] shows three contrasts. A considerable number of nano-sized precipitates in grey contrast are
distributed at the grain boundaries and inside the grains of the matrix, where a few black precipitates are