
Page 99 - Read Online
P. 99
Wan et al. Microstructures 2023;3:2023014 https://dx.doi.org/10.20517/microstructures.2022.36 Page 5 of 19
Table 1. Quantitative EDS analysis (in atomic percentage) for the as-sintered Cr MnFeCoNi (x = 0, 0.6, 1, and 1.5) HEAs
x
Sample Co Fe Mn Ni Cr
Cr0 25.0 25.4 25.0 24.6 -
Cr0.6 21.7 21.7 22.3 21.1 13.2
Cr1 19.4 20.3 20.2 19.7 20.4
Cr1.5 18.1 18.2 18.4 18.1 27.2
EDS: Energy-dispersive X-ray spectroscopy; HEAs: high-entropy alloys.
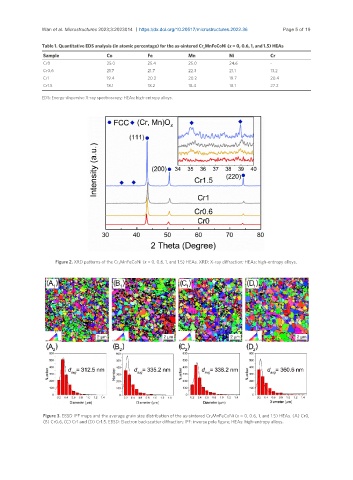
Figure 2. XRD patterns of the Cr xMnFeCoNi (x = 0, 0.6, 1, and 1.5) HEAs. XRD: X-ray diffraction; HEAs: high-entropy alloys.
Figure 3. EBSD IPF maps and the average grain size distribution of the as-sintered Cr x MnFeCoNi (x = 0, 0.6, 1, and 1.5) HEAs. (A) Cr0,
(B) Cr0.6, (C) Cr1 and (D) Cr1.5. EBSD: Electron backscatter diffraction; IPF: inverse pole figure; HEAs: high-entropy alloys.