
Page 103 - Read Online
P. 103
Wan et al. Microstructures 2023;3:2023014 https://dx.doi.org/10.20517/microstructures.2022.36 Page 9 of 19
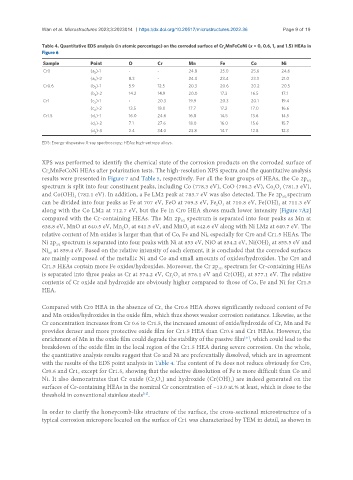
Table 4. Quantitative EDS analysis (in atomic percentage) on the corroded surface of Cr MnFeCoNi (x = 0, 0.6, 1, and 1.5) HEAs in
x
Figure 6
Sample Point O Cr Mn Fe Co Ni
Cr0 (a )-1 - - 24.8 25.0 25.6 24.6
2
(a )-2 8.3 - 24.0 23.4 23.3 21.0
2
Cr0.6 (b )-1 5.9 12.5 20.3 20.6 20.2 20.5
2
(b )-2 14.2 14.9 20.0 17.3 16.5 17.1
2
Cr1 (c )-1 - 20.3 19.9 20.3 20.1 19.4
2
(c )-2 13.5 18.0 17.7 17.2 17.0 16.6
2
Cr1.5 (d )-1 16.0 24.6 16.8 14.5 13.6 14.5
2
(d )-2 7.1 27.6 18.0 16.0 15.6 15.7
2
(d )-3 2.4 34.0 23.8 14.7 12.8 12.3
2
EDS: Energy-dispersive X-ray spectroscopy; HEAs: high-entropy alloys.
XPS was performed to identify the chemical state of the corrosion products on the corroded surface of
Cr MnFeCoNi HEAs after polarization tests. The high-resolution XPS spectra and the quantitative analysis
x
results were presented in Figure 7 and Table 5, respectively. For all the four groups of HEAs, the Co 2p
3/2
spectrum is split into four constituent peaks, including Co (778.3 eV), CoO (780.2 eV), Co O (781.3 eV),
3
2
and Co(OH) (782.1 eV). In addition, a Fe LM2 peak at 783.7 eV was also detected. The Fe 2p spectrum
2
3/2
can be divided into four peaks as Fe at 707 eV, FeO at 709.3 eV, Fe O at 710.8 eV, Fe(OH) at 711.3 eV
3
3
2
along with the Co LM2 at 712.7 eV, but the Fe in Cr0 HEA shows much lower intensity [Figure 7A2]
compared with the Cr-containing HEAs. The Mn 2p spectrum is separated into four peaks as Mn at
3/2
638.8 eV, MnO at 640.5 eV, Mn O at 641.5 eV, and MnO at 642.6 eV along with Ni LM2 at 640.7 eV. The
2
3
2
relative content of Mn oxides is larger than that of Co, Fe and Ni, especially for Cr0 and Cr1.5 HEAs. The
Ni 2p spectrum is separated into four peaks with Ni at 853 eV, NiO at 854.2 eV, Ni(OH) at 855.5 eV and
3/2
2
Ni at 859.4 eV. Based on the relative intensity of each element, it is concluded that the corroded surfaces
sat
are mainly composed of the metallic Ni and Co and small amounts of oxides/hydroxides. The Cr0 and
Cr1.5 HEAs contain more Fe oxides/hydroxides. Moreover, the Cr 2p spectrum for Cr-containing HEAs
3/2
is separated into three peaks as Cr at 574.2 eV, Cr O at 576.1 eV and Cr(OH) at 577.1 eV. The relative
3
3
2
contents of Cr oxide and hydroxide are obviously higher compared to those of Co, Fe and Ni for Cr1.5
HEA.
Compared with Cr0 HEA in the absence of Cr, the Cr0.6 HEA shows significantly reduced content of Fe
and Mn oxides/hydroxides in the oxide film, which thus shows weaker corrosion resistance. Likewise, as the
Cr concentration increases from Cr 0.6 to Cr1.5, the increased amount of oxide/hydroxide of Cr, Mn and Fe
provides denser and more protective oxide film for Cr1.5 HEA than Cr0.6 and Cr1 HEAs. However, the
enrichment of Mn in the oxide film could degrade the stability of the passive film , which could lead to the
[31]
breakdown of the oxide film in the local region of the Cr1.5 HEA during severe corrosion. On the whole,
the quantitative analysis results suggest that Co and Ni are preferentially dissolved, which are in agreement
with the results of the EDS point analysis in Table 4. The content of Fe does not reduce obviously for Cr0,
Cr0.6 and Cr1, except for Cr1.5, showing that the selective dissolution of Fe is more difficult than Co and
Ni. It also demonstrates that Cr oxide (Cr O ) and hydroxide (Cr(OH) ) are indeed generated on the
2
3
3
surfaces of Cr-containing HEAs in the nominal Cr concentration of ~13.0 at.% at least, which is close to the
threshold in conventional stainless steels .
[12]
In order to clarify the honeycomb-like structure of the surface, the cross-sectional microstructure of a
typical corrosion micropore located on the surface of Cr1 was characterized by TEM in detail, as shown in