
Page 108 - Read Online
P. 108
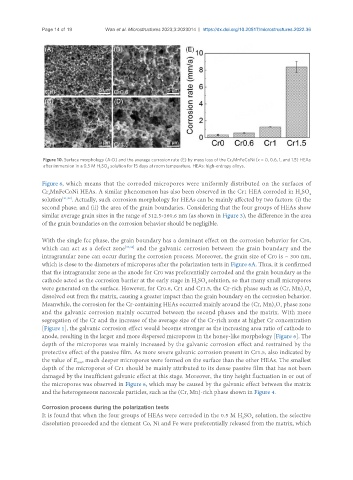
Page 14 of 19         Wan et al. Microstructures 2023;3:2023014  https://dx.doi.org/10.20517/microstructures.2022.36


                Figure 10. Surface morphology (A-D) and the average corrosion rate (E) by mass loss of the Cr x MnFeCoNi (x = 0, 0.6, 1, and 1.5) HEAs
                after immersion in a 0.5 M H SO  solution for 15 days at room temperature. HEAs: high-entropy alloys.
                                   2
                                     4
               Figure 6, which means that the corroded micropores were uniformly distributed on the surfaces of
               Cr MnFeCoNi HEAs. A similar phenomenon has also been observed in the Cr1 HEA corroded in H SO
                                                                                                         4
                                                                                                      2
                 x
               solution [21,22] . Actually, such corrosion morphology for HEAs can be mainly affected by two factors: (i) the
               second phase; and (ii) the area of the grain boundaries. Considering that the four groups of HEAs show
               similar average grain sizes in the range of 312.5-360.6 nm (as shown in Figure 3), the difference in the area
               of the grain boundaries on the corrosion behavior should be negligible.

               With the single fcc phase, the grain boundary has a dominant effect on the corrosion behavior for Cr0,
               which can act as a defect zone [37,38]  and the galvanic corrosion between the grain boundary and the
               intragranular zone can occur during the corrosion process. Moreover, the grain size of Cr0 is ~ 300 nm,
               which is close to the diameters of micropores after the polarization tests in Figure 6A. Thus, it is confirmed
               that the intragranular zone as the anode for Cr0 was preferentially corroded and the grain boundary as the
               cathode acted as the corrosion barrier at the early stage in H SO solution, so that many small micropores
                                                                   2
                                                                      4
               were generated on the surface. However, for Cr0.6, Cr1 and Cr1.5, the Cr-rich phase such as (Cr, Mn) O
                                                                                                       3
                                                                                                         4
               dissolved out from the matrix, causing a greater impact than the grain boundary on the corrosion behavior.
               Meanwhile, the corrosion for the Cr-containing HEAs occurred mainly around the (Cr, Mn) O  phase zone
                                                                                             3
                                                                                               4
               and the galvanic corrosion mainly occurred between the second phases and the matrix. With more
               segregation of the Cr and the increase of the average size of the Cr-rich zone at higher Cr concentration
               [Figure 1], the galvanic corrosion effect would become stronger as the increasing area ratio of cathode to
               anode, resulting in the larger and more dispersed micropores in the honey-like morphology [Figure 6]. The
               depth of the micropores was mainly increased by the galvanic corrosion effect and restrained by the
               protective effect of the passive film. As more severe galvanic corrosion present in Cr1.5, also indicated by
               the value of E , much deeper micropores were formed on the surface than the other HEAs. The smallest
                           corr
               depth of the micropores of Cr1 should be mainly attributed to its dense passive film that has not been
               damaged by the insufficient galvanic effect at this stage. Moreover, the tiny height fluctuation in or out of
               the micropores was observed in Figure 6, which may be caused by the galvanic effect between the matrix
               and the heterogeneous nanoscale particles, such as the (Cr, Mn)-rich phase shown in Figure 4.

               Corrosion process during the polarization tests
               It is found that when the four groups of HEAs were corroded in the 0.5 M H SO  solution, the selective
                                                                                   2
                                                                                      4
               dissolution proceeded and the element Co, Ni and Fe were preferentially released from the matrix, which