
Page 106 - Read Online
P. 106
Page 12 of 19 Wan et al. Microstructures 2023;3:2023014 https://dx.doi.org/10.20517/microstructures.2022.36
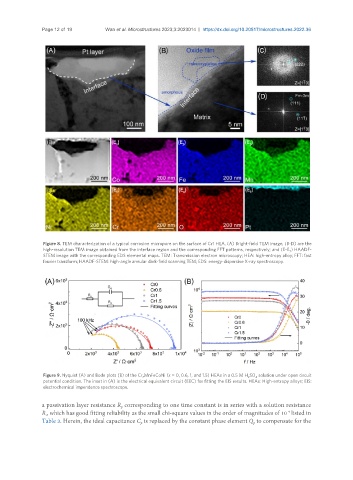
Figure 8. TEM characterization of a typical corrosion micropore on the surface of Cr1 HEA. (A) Bright-field TEM image; (B-D) are the
high-resolution TEM image obtained from the interface region and the corresponding FFT patterns, respectively; and (E-E ) HAADF-
7
STEM image with the corresponding EDS elemental maps. TEM: Transmission electron microscopy; HEA: high-entropy alloy; FFT: fast
fourier transform; HAADF-STEM: high-angle annular dark-field scanning TEM; EDS: energy-dispersive X-ray spectroscopy.
Figure 9. Nyquist (A) and Bode plots (B) of the Cr xMnFeCoNi (x = 0, 0.6, 1, and 1.5) HEAs in a 0.5 M H SO solution under open circuit
2
4
potential condition. The inset in (A) is the electrical equivalent circuit (EEC) for fitting the EIS results. HEAs: High-entropy alloys; EIS:
electrochemical impendence spectroscope.
a passivation layer resistance R corresponding to one time constant is in series with a solution resistance
p
R , which has good fitting reliability as the small chi-square values in the order of magnitudes of 10 listed in
-4
s
Table 3. Herein, the ideal capacitance C is replaced by the constant phase element Q to compensate for the
p
p