
Page 102 - Read Online
P. 102
Page 8 of 19 Wan et al. Microstructures 2023;3:2023014 https://dx.doi.org/10.20517/microstructures.2022.36
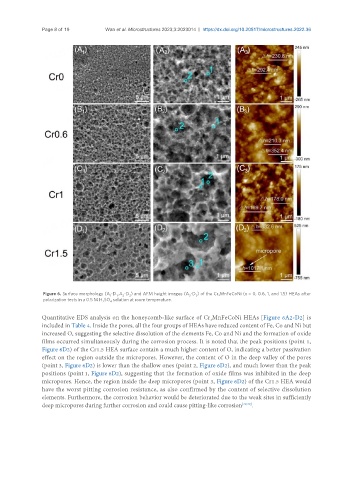
Figure 6. Surface morphology (A -D , A -D ) and AFM height images (A -D ) of the Cr xMnFeCoNi (x = 0, 0.6, 1, and 1.5) HEAs after
3
3
1
2
2
1
polarization tests in a 0.5 M H SO solution at room temperature.
4
2
Quantitative EDS analysis on the honeycomb-like surface of Cr MnFeCoNi HEAs [Figure 6A2-D2] is
x
included in Table 4. Inside the pores, all the four groups of HEAs have reduced content of Fe, Co and Ni but
increased O, suggesting the selective dissolution of the elements Fe, Co and Ni and the formation of oxide
films occurred simultaneously during the corrosion process. It is noted that the peak positions (point 1,
Figure 6D2) of the Cr1.5 HEA surface contain a much higher content of O, indicating a better passivation
effect on the region outside the micropores. However, the content of O in the deep valley of the pores
(point 3, Figure 6D2) is lower than the shallow ones (point 2, Figure 6D2), and much lower than the peak
positions (point 1, Figure 6D2), suggesting that the formation of oxide films was inhibited in the deep
micropores. Hence, the region inside the deep micropores (point 3, Figure 6D2) of the Cr1.5 HEA would
have the worst pitting corrosion resistance, as also confirmed by the content of selective dissolution
elements. Furthermore, the corrosion behavior would be deteriorated due to the weak sites in sufficiently
deep micropores during further corrosion and could cause pitting-like corrosion [29,30] .