
Page 101 - Read Online
P. 101
Wan et al. Microstructures 2023;3:2023014 https://dx.doi.org/10.20517/microstructures.2022.36 Page 7 of 19
Table 2. Quantitative EDS analysis (in atomic percentage) of Cr1 HEA in Figure 4A
Point O Cr Mn Fe Co Ni
1 - 16.3 21.3 21.6 19.8 21.0
2 10.4 26.4 22.1 13.4 13.3 14.4
3 47.3 31.1 21.6 - - -
EDS: Energy-dispersive X-ray spectroscopy; HEA: high-entropy alloy.
Table 3. Polarization parameters and equivalent circuit parameters for EIS of Cr MnFeCoNi (x = 0, 0.6, 1 and 1.5) HEAs in a
x
0.5 M H SO solution
4
2
-2
Sample E /V I /μA/cm 2 Y /S·cm ·s n n p R /Ω·cm 2 chsq
corr
p
p
corr
Cr0 -0.40 ± 0.01 4.20 ± 0.08 2.60E-08 0.74 6113 2.28E-04
Cr0.6 -0.41 ± 0.03 5.36 ± 1.05 1.25E-08 0.79 3510 1.47E-04
Cr1 -0.44 ± 0.01 3.33 ± 1.61 9.35E-09 0.84 5506 1.85E-04
Cr1.5 -0.45 ± 0.01 2.75 ± 1.41 1.11E-08 0.82 7715 5.73E-04
EIS: Electrochemical impendence spectroscope; HEAs: high-entropy alloys.
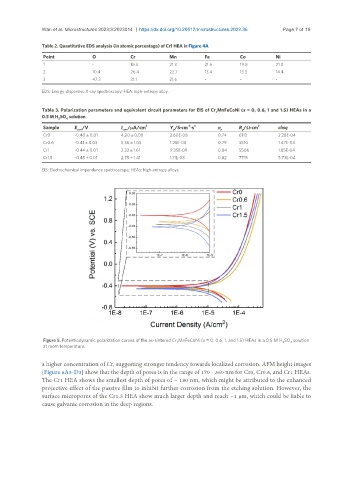
Figure 5. Potentiodynamic polarization curves of the as-sintered Cr xMnFeCoNi (x = 0, 0.6, 1, and 1.5) HEAs in a 0.5 M H SO solution
2 4
at room temperature.
a higher concentration of Cr, suggesting stronger tendency towards localized corrosion. AFM height images
[Figure 6A3-D3] show that the depth of pores is in the range of 170 - 360 nm for Cr0, Cr0.6, and Cr1 HEAs.
The Cr1 HEA shows the smallest depth of pores of ~ 180 nm, which might be attributed to the enhanced
protective effect of the passive film to inhibit further corrosion from the etching solution. However, the
surface micropores of the Cr1.5 HEA show much larger depth and reach ~1 μm, which could be liable to
cause galvanic corrosion in the deep regions.