
Page 110 - Read Online
P. 110
Page 16 of 19 Wan et al. Microstructures 2023;3:2023014 https://dx.doi.org/10.20517/microstructures.2022.36
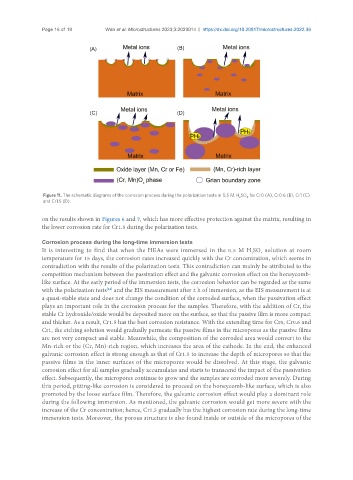
Figure 11. The schematic diagrams of the corrosion process during the polarization tests in 0.5 M H SO for Cr0 (A), Cr0.6 (B), Cr1 (C)
2 4
and Cr1.5 (D).
on the results shown in Figures 6 and 7, which has more effective protection against the matrix, resulting in
the lower corrosion rate for Cr1.5 during the polarization tests.
Corrosion process during the long-time immersion tests
It is interesting to find that when the HEAs were immersed in the 0.5 M H SO solution at room
2
4
temperature for 15 days, the corrosion rates increased quickly with the Cr concentration, which seems in
contradiction with the results of the polarization tests. This contradiction can mainly be attributed to the
competition mechanism between the passivation effect and the galvanic corrosion effect on the honeycomb-
like surface. At the early period of the immersion tests, the corrosion behavior can be regarded as the same
[44]
with the polarization tests and the EIS measurement after 2 h of immersion, as the EIS measurement is at
a quasi-stable state and does not change the condition of the corroded surface, when the passivation effect
plays an important role in the corrosion process for the samples. Therefore, with the addition of Cr, the
stable Cr hydroxide/oxide would be deposited more on the surface, so that the passive film is more compact
and thicker. As a result, Cr1.5 has the best corrosion resistance. With the extending time for Cr0, Cr0.6 and
Cr1, the etching solution would gradually permeate the passive films in the micropores as the passive films
are not very compact and stable. Meanwhile, the composition of the corroded area would convert to the
Mn-rich or the (Cr, Mn)-rich region, which increases the area of the cathode. In the end, the enhanced
galvanic corrosion effect is strong enough as that of Cr1.5 to increase the depth of micropores so that the
passive films in the inner surfaces of the micropores would be dissolved. At this stage, the galvanic
corrosion effect for all samples gradually accumulates and starts to transcend the impact of the passivation
effect. Subsequently, the micropores continue to grow and the samples are corroded more severely. During
this period, pitting-like corrosion is considered to proceed on the honeycomb-like surface, which is also
promoted by the loose surface film. Therefore, the galvanic corrosion effect would play a dominant role
during the following immersion. As mentioned, the galvanic corrosion would get more severe with the
increase of the Cr concentration; hence, Cr1.5 gradually has the highest corrosion rate during the long-time
immersion tests. Moreover, the porous structure is also found inside or outside of the micropores of the