
Page 99 - Read Online
P. 99
Rao. Vessel Plus 2022;6:25 https://dx.doi.org/10.20517/2574-1209.2021.92 Page 9 of 41
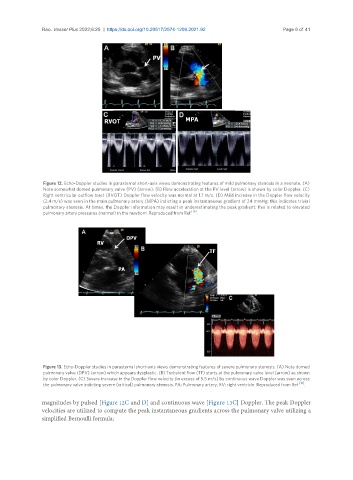
Figure 12. Echo-Doppler studies in parasternal short-axis views demonstrating features of mild pulmonary stenosis in a neonate. (A)
Note somewhat domed pulmonary valve (PV) (arrow). (B) Flow acceleration at the PV level (arrow) is shown by color Doppler. (C)
Right ventricular outflow tract (RVOT) Doppler flow velocity was normal at 1.1 m/s. (D) Mild increase in the Doppler flow velocity
(2.4 m/s) was seen in the main pulmonary artery (MPA) indicting a peak instantaneous gradient of 24 mmHg; this indicates trivial
pulmonary stenosis. At times, the Doppler information may result in underestimating the peak gradient; this is related to elevated
pulmonary artery pressures (normal) in the newborn. Reproduced from Ref. [16] .
Figure 13. Echo-Doppler studies in parasternal short-axis views demonstrating features of severe pulmonary stenosis. (A) Note domed
pulmonary valve (DPV) (arrow) which appears dysplastic. (B) Turbulent flow (TF) starts at the pulmonary valve level (arrow) as shown
by color Doppler. (C) Severe increase in the Doppler flow velocity (in excess of 5.5 m/s) by continuous wave Doppler was seen across
the pulmonary valve indicting severe (critical) pulmonary stenosis. PA: Pulmonary artery; RV: right ventricle. Reproduced from Ref. [16] .
magnitudes by pulsed [Figure 12C and D] and continuous wave [Figure 13C] Doppler. The peak Doppler
velocities are utilized to compute the peak instantaneous gradients across the pulmonary valve utilizing a
simplified Bernoulli formula: