
Page 94 - Read Online
P. 94
Page 4 of 41 Rao. Vessel Plus 2022;6:25 https://dx.doi.org/10.20517/2574-1209.2021.92
Figure 3. Echocardiographic studies in parasternal long-axis (A) and apical five-chamber (B) projections illustrating the subaortic
membrane (SAM). The position of the aortic valve (AV) is shown. Continuous wave and color Doppler studies demonstrated elevated
Doppler flow velocity across SAM, but are not shown in these echo frames. The left atrium (LA) and left ventricle (LV) are labeled.
[4]
Reproduced from Ref. .
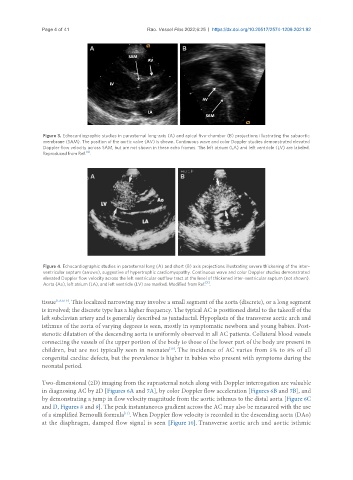
Figure 4. Echocardiographic studies in parasternal long (A) and short (B) axis projections illustrating severe thickening of the inter-
ventricular septum (arrows), suggestive of hypertrophic cardiomyopathy. Continuous wave and color Doppler studies demonstrated
elevated Doppler flow velocity across the left ventricular outflow tract at the level of thickened inter-ventricular septum (not shown).
[3]
Aorta (Ao), left atrium (LA), and left ventricle (LV) are marked. Modified from Ref. .
tissue [1,3,9,10] . This localized narrowing may involve a small segment of the aorta (discrete), or a long segment
is involved; the discrete type has a higher frequency. The typical AC is positioned distal to the takeoff of the
left subclavian artery and is generally described as juxtaductal. Hypoplasia of the transverse aortic arch and
isthmus of the aorta of varying degrees is seen, mostly in symptomatic newborn and young babies. Post-
stenotic dilatation of the descending aorta is uniformly observed in all AC patients. Collateral blood vessels
connecting the vessels of the upper portion of the body to those of the lower part of the body are present in
children, but are not typically seen in neonates . The incidence of AC varies from 5% to 8% of all
[10]
congenital cardiac defects, but the prevalence is higher in babies who present with symptoms during the
neonatal period.
Two-dimensional (2D) imaging from the suprasternal notch along with Doppler interrogation are valuable
in diagnosing AC by 2D [Figures 6A and 7A], by color Doppler flow acceleration [Figures 6B and 7B], and
by demonstrating a jump in flow velocity magnitude from the aortic isthmus to the distal aorta [Figure 6C
and D, Figures 8 and 9]. The peak instantaneous gradient across the AC may also be measured with the use
of a simplified Bernoulli formula . When Doppler flow velocity is recorded in the descending aorta (DAo)
[11]
at the diaphragm, damped flow signal is seen [Figure 10]. Transverse aortic arch and aortic isthmic