
Page 59 - Read Online
P. 59
Ponsero et al. Microbiome Res Rep 2023;2:27 https://dx.doi.org/10.20517/mrr.2023.26 Page 11 of 21
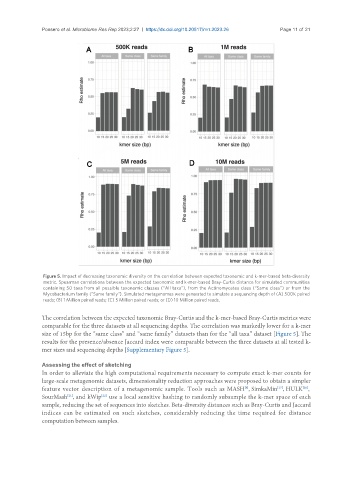
Figure 5. Impact of decreasing taxonomic diversity on the correlation between expected taxonomic and k-mer-based beta-diversity
metric. Spearman correlations between the expected taxonomic and k-mer-based Bray-Curtis distance for simulated communities
containing 50 taxa from all possible taxonomic classes (“All taxa”), from the Actinomycetes class (“Same class”) or from the
Mycobacterium family (“Same family”). Simulated metagenomes were generated to simulate a sequencing depth of (A) 500K paired
reads; (B) 1 Million paired reads; (C) 5 Million paired reads; or (D) 10 Million paired reads.
The correlation between the expected taxonomic Bray-Curtis and the k-mer-based Bray-Curtis metrics were
comparable for the three datasets at all sequencing depths. The correlation was markedly lower for a k-mer
size of 15bp for the “same class” and “same family” datasets than for the “all taxa” dataset [Figure 5]. The
results for the presence/absence Jaccard index were comparable between the three datasets at all tested k-
mer sizes and sequencing depths [Supplementary Figure 5].
Assessing the effect of sketching
In order to alleviate the high computational requirements necessary to compute exact k-mer counts for
large-scale metagenomic datasets, dimensionality reduction approaches were proposed to obtain a simpler
feature vector description of a metagenomic sample. Tools such as MASH , SimkaMin , HULK ,
[20]
[8]
[17]
SourMash , and kWip use a local sensitive hashing to randomly subsample the k-mer space of each
[22]
[21]
sample, reducing the set of sequences into sketches. Beta-diversity distances such as Bray-Curtis and Jaccard
indices can be estimated on such sketches, considerably reducing the time required for distance
computation between samples.