
Page 55 - Read Online
P. 55
Ponsero et al. Microbiome Res Rep 2023;2:27 https://dx.doi.org/10.20517/mrr.2023.26 Page 7 of 21
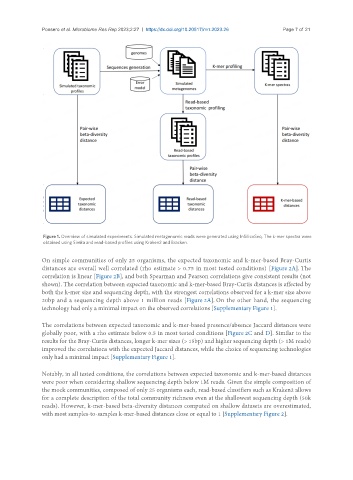
Figure 1. Overview of simulated experiments. Simulated metagenomic reads were generated using InSilicoSeq. The k-mer spectra were
obtained using Simka and read-based profiles using Kraken2 and Bracken.
On simple communities of only 25 organisms, the expected taxonomic and k-mer-based Bray-Curtis
distances are overall well correlated (rho estimate > 0.75 in most tested conditions) [Figure 2A]. The
correlation is linear [Figure 2B], and both Spearman and Pearson correlations give consistent results (not
shown). The correlation between expected taxonomic and k-mer-based Bray-Curtis distances is affected by
both the k-mer size and sequencing depth, with the strongest correlations observed for a k-mer size above
20bp and a sequencing depth above 1 million reads [Figure 2A]. On the other hand, the sequencing
technology had only a minimal impact on the observed correlations [Supplementary Figure 1].
The correlations between expected taxonomic and k-mer-based presence/absence Jaccard distances were
globally poor, with a rho estimate below 0.5 in most tested conditions [Figure 2C and D]. Similar to the
results for the Bray-Curtis distances, longer k-mer sizes (> 15bp) and higher sequencing depth (> 1M reads)
improved the correlations with the expected Jaccard distances, while the choice of sequencing technologies
only had a minimal impact [Supplementary Figure 1].
Notably, in all tested conditions, the correlations between expected taxonomic and k-mer-based distances
were poor when considering shallow sequencing depth below 1M reads. Given the simple composition of
the mock communities, composed of only 25 organisms each, read-based classifiers such as Kraken2 allows
for a complete description of the total community richness even at the shallowest sequencing depth (50k
reads). However, k-mer-based beta-diversity distances computed on shallow datasets are overestimated,
with most samples-to-samples k-mer-based distances close or equal to 1 [Supplementary Figure 2].