
Page 61 - Read Online
P. 61
Ponsero et al. Microbiome Res Rep 2023;2:27 https://dx.doi.org/10.20517/mrr.2023.26 Page 13 of 21
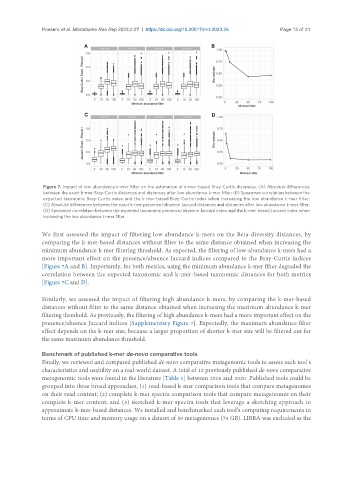
Figure 7. Impact of low abundance k-mer filter on the estimation of k-mer-based Bray-Curtis distances. (A) Absolute differences
between the exact k-mer Bray-Curtis distances and distances after low abundance k-mer filter; (B) Spearman correlation between the
expected taxonomic Bray-Curtis index and the k-mer-based Bray-Curtis index when increasing the low abundance k-mer filter;
(C) Absolute differences between the exact k-mer presence/absence Jaccard distances and distances after low abundance k-mer filter;
(D) Spearman correlation between the expected taxonomic presence/absence Jaccard index and the k-mer-based Jaccard index when
increasing the low abundance k-mer filter.
We first assessed the impact of filtering low abundance k-mers on the Beta-diversity distances, by
comparing the k-mer-based distances without filter to the same distance obtained when increasing the
minimum abundance k-mer filtering threshold. As expected, the filtering of low-abundance k-mers had a
more important effect on the presence/absence Jaccard indices compared to the Bray-Curtis indices
[Figure 7A and B]. Importantly, for both metrics, using the minimum abundance k-mer filter degraded the
correlation between the expected taxonomic and k-mer-based taxonomic distances for both metrics
[Figure 7C and D].
Similarly, we assessed the impact of filtering high abundance k-mers, by comparing the k-mer-based
distances without filter to the same distance obtained when increasing the maximum abundance k-mer
filtering threshold. As previously, the filtering of high abundance k-mers had a more important effect on the
presence/absence Jaccard indices [Supplementary Figure 7]. Expectedly, the maximum abundance filter
effect depends on the k-mer size, because a larger proportion of shorter k-mer size will be filtered out for
the same maximum abundance threshold.
Benchmark of published k-mer de-novo comparative tools
Finally, we reviewed and compared published de-novo comparative metagenomic tools to assess each tool’s
characteristics and usability on a real-world dataset. A total of 12 previously published de-novo comparative
metagenomic tools were found in the literature [Table 1] between 2016 and 2020. Published tools could be
grouped into three broad approaches, (1) read-based k-mer comparison tools that compare metagenomes
on their read content; (2) complete k-mer spectra comparison tools that compare metagenomes on their
complete k-mer content; and (3) sketched k-mer spectra tools that leverage a sketching approach to
approximate k-mer-based distances. We installed and benchmarked each tool’s computing requirements in
terms of CPU time and memory usage on a dataset of 30 metagenomes (74 GB). LIBRA was excluded as the