
Page 63 - Read Online
P. 63
Ponsero et al. Microbiome Res Rep 2023;2:27 https://dx.doi.org/10.20517/mrr.2023.26 Page 15 of 21
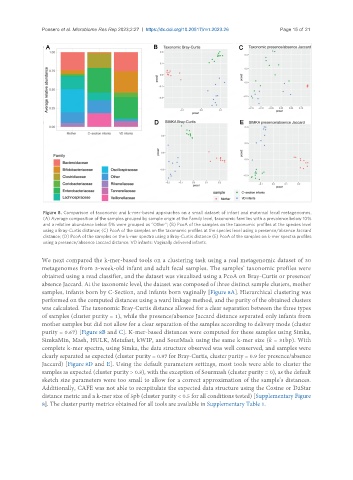
Figure 8. Comparison of taxonomic and k-mer-based approaches on a small dataset of infant and maternal fecal metagenomes.
(A) Average composition of the samples grouped by sample origin at the Family level, taxonomic families with a prevalence below 10%
and a relative abundance below 5% were grouped as “Other”; (B) PcoA of the samples on the taxonomic profiles at the species level
using a Bray-Curtis distance; (C) PcoA of the samples on the taxonomic profiles at the species level using a presence/absence Jaccard
distance; (D) PcoA of the samples on the k-mer spectra using a Bray-Curtis distance (E) PcoA of the samples on k-mer spectra profiles
using a presence/absence Jaccard distance. VD infants: Vaginally delivered infants.
We next compared the k-mer-based tools on a clustering task using a real metagenomic dataset of 30
metagenomes from 3-week-old infant and adult fecal samples. The samples’ taxonomic profiles were
obtained using a read classifier, and the dataset was visualized using a PcoA on Bray-Curtis or presence/
absence Jaccard. At the taxonomic level, the dataset was composed of three distinct sample clusters, mother
samples, infants born by C-Section, and infants born vaginally [Figure 8A]. Hierarchical clustering was
performed on the computed distances using a ward linkage method, and the purity of the obtained clusters
was calculated. The taxonomic Bray-Curtis distance allowed for a clear separation between the three types
of samples (cluster purity = 1), while the presence/absence Jaccard distance separated only infants from
mother samples but did not allow for a clear separation of the samples according to delivery mode (cluster
purity = 0.67) [Figure 8B and C]. K-mer-based distances were computed for these samples using Simka,
SimkaMin, Mash, HULK, Metafast, kWIP, and SourMash using the same k-mer size (k = 31bp). With
complete k-mer spectra, using Simka, the data structure observed was well conserved, and samples were
clearly separated as expected (cluster purity = 0.97 for Bray-Curtis, cluster purity = 0.9 for presence/absence
Jaccard) [Figure 8D and E]. Using the default parameters settings, most tools were able to cluster the
samples as expected (cluster purity > 0.8), with the exception of Sourmash (cluster purity = 0), as the default
sketch size parameters were too small to allow for a correct approximation of the sample’s distances.
Additionally, CAFE was not able to recapitulate the expected data structure using the Cosine or D2Star
distance metric and a k-mer size of 5pb (cluster purity < 0.5 for all conditions tested) [Supplementary Figure
8]. The cluster purity metrics obtained for all tools are available in Supplementary Table 1.