
Page 64 - Read Online
P. 64
Page 16 of 21 Ponsero et al. Microbiome Res Rep 2023;2:27 https://dx.doi.org/10.20517/mrr.2023.26
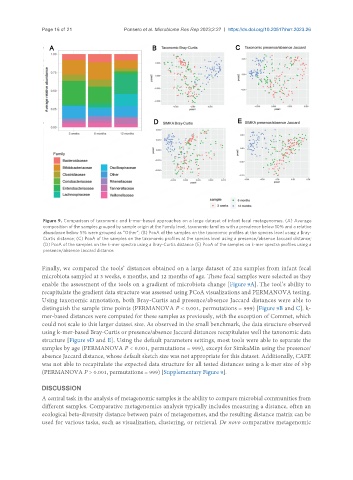
Figure 9. Comparison of taxonomic and k-mer-based approaches on a large dataset of infant fecal metagenomes. (A) Average
composition of the samples grouped by sample origin at the Family level, taxonomic families with a prevalence below 10% and a relative
abundance below 5% were grouped as “Other”; (B) PcoA of the samples on the taxonomic profiles at the species level using a Bray-
Curtis distance; (C) PcoA of the samples on the taxonomic profiles at the species level using a presence/absence Jaccard distance;
(D) PcoA of the samples on the k-mer spectra using a Bray-Curtis distance (E) PcoA of the samples on k-mer spectra profiles using a
presence/absence Jaccard distance.
Finally, we compared the tools’ distances obtained on a large dataset of 224 samples from infant fecal
microbiota sampled at 3 weeks, 6 months, and 12 months of age. These fecal samples were selected as they
enable the assessment of the tools on a gradient of microbiota change [Figure 9A]. The tool’s ability to
recapitulate the gradient data structure was assessed using PCoA visualizations and PERMANOVA testing.
Using taxonomic annotation, both Bray-Curtis and presence/absence Jaccard distances were able to
distinguish the sample time points (PERMANOVA P < 0.001, permutations = 999) [Figure 9B and C]. k-
mer-based distances were computed for these samples as previously, with the exception of Commet, which
could not scale to this larger dataset size. As observed in the small benchmark, the data structure observed
using k-mer-based Bray-Curtis or presence/absence Jaccard distances recapitulates well the taxonomic data
structure [Figure 9D and E]. Using the default parameters settings, most tools were able to separate the
samples by age (PERMANOVA P < 0.001, permutations = 999), except for SimkaMin using the presence/
absence Jaccard distance, whose default sketch size was not appropriate for this dataset. Additionally, CAFE
was not able to recapitulate the expected data structure for all tested distances using a k-mer size of 5bp
(PERMANOVA P > 0.001, permutations = 999) [Supplementary Figure 9].
DISCUSSION
A central task in the analysis of metagenomic samples is the ability to compare microbial communities from
different samples. Comparative metagenomics analysis typically includes measuring a distance, often an
ecological beta-diversity distance between pairs of metagenomes, and the resulting distance matrix can be
used for various tasks, such as visualization, clustering, or retrieval. De novo comparative metagenomic