


Page 148 - Read Online
P. 148
Zhang et al. J. Mater. Inf. 2026, 6, 11                                           Page 9 of 17


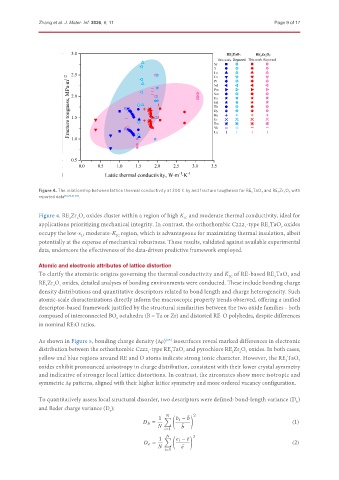
               Figure 4. The relationship between lattice thermal conductivity at 300 K by and fracture toughness for RE 3 TaO 7  and RE 2 Zr 2 O 7  with
               reported data [10,76,81-83] .


               Figure 4. RE Zr O  oxides cluster within a region of high K  and moderate thermal conductivity, ideal for
                              7
                                                                  IC
                            2
                         2
               applications prioritizing mechanical integrity. In contrast, the orthorhombic C222 -type RE TaO  oxides
                                                                                       1
                                                                                                    7
                                                                                               3
               occupy the low-κ , moderate-K  region, which is advantageous for maximizing thermal insulation, albeit
                                          IC
                              L
               potentially at the expense of mechanical robustness. These results, validated against available experimental
               data, underscore the effectiveness of the data-driven predictive framework employed.
               Atomic and electronic attributes of lattice distortion
               To clarify the atomistic origins governing the thermal conductivity and K  of RE-based RE TaO  and
                                                                                 IC
                                                                                                 3
                                                                                                      7
               RE Zr O  oxides, detailed analyses of bonding environments were conducted. These include bonding charge
                    2
                      7
                 2
               density distributions and quantitative descriptors related to bond length and charge heterogeneity. Such
               atomic-scale characterizations directly inform the macroscopic property trends observed, offering a unified
               descriptor-based framework justified by the structural similarities between the two oxide families - both
               composed of interconnected BO  octahedra (B = Ta or Zr) and distorted RE–O polyhedra, despite differences
                                          6
               in nominal RE:O ratios.
               As shown in Figure 5, bonding charge density (Δρ)  isosurfaces reveal marked differences in electronic
                                                           [65]
               distribution between the orthorhombic C222 -type RE TaO  and pyrochlore RE Zr O  oxides. In both cases,
                                                                                       7
                                                             3
                                                                 7
                                                                                     2
                                                                                   2
                                                     1
               yellow and blue regions around RE and O atoms indicate strong ionic character. However, the RE TaO 7
                                                                                                     3
               oxides exhibit pronounced anisotropy in charge distribution, consistent with their lower crystal symmetry
               and indicative of stronger local lattice distortions. In contrast, the zirconates show more isotropic and
               symmetric Δρ patterns, aligned with their higher lattice symmetry and more ordered vacancy configuration.
               To quantitatively assess local structural disorder, two descriptors were defined: bond-length variance (D )
                                                                                                         b
               and Bader charge variance (D ):
                                        e
                                                              (     ) 2
                                                         1           −    ¯
                                                              ∑
                                                         =                                              (1)
                                                                 ¯

                                                             =1
                                                              (     ) 2
                                                              ∑
                                                         1           − ¯
                                                         =                                              (2)
                                                                 ¯
                                                             =1

