
Page 58 - Read Online
P. 58
Page 10 of 17 Lekbir et al. Energy Mater. 2025, 5, 500101 https://dx.doi.org/10.20517/energymater.2025.46
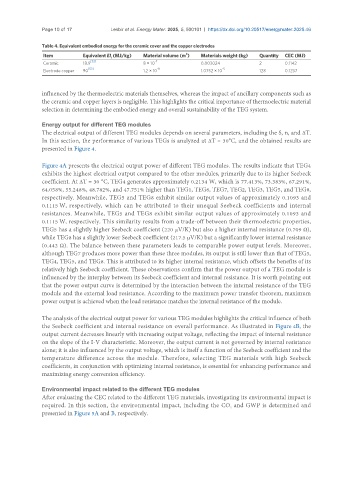
Table 4. Equivalent embodied energy for the ceramic cover and the copper electrodes
3
Item Equivalent EI (MJ/kg) Material volume (m ) Materials weight (kg) Quantity CEC (MJ)
i
Ceramic 18.9 [52] 8 × 10 -7 0.003024 2 0.1142
[53] -9 -5
Electrode copper 90 1.2 × 10 1.0752 × 10 128 0.1237
influenced by the thermoelectric materials themselves, whereas the impact of ancillary components such as
the ceramic and copper layers is negligible. This highlights the critical importance of thermoelectric material
selection in determining the embodied energy and overall sustainability of the TEG system.
Energy output for different TEG modules
The electrical output of different TEG modules depends on several parameters, including the S, n, and ΔT.
In this section, the performance of various TEGs is analyzed at ΔT = 30°C, and the obtained results are
presented in Figure 4.
Figure 4A presents the electrical output power of different TEG modules. The results indicate that TEG4
exhibits the highest electrical output compared to the other modules, primarily due to its higher Seebeck
coefficient. At ΔT = 30 °C, TEG4 generates approximately 0.2134 W, which is 77.413%, 73.383%, 67.291%,
64.058%, 55.248%, 48.782%, and 47.751% higher than TEG1, TEG6, TEG7, TEG2, TEG3, TEG5, and TEG8,
respectively. Meanwhile, TEG5 and TEG8 exhibit similar output values of approximately 0.1093 and
0.1115 W, respectively, which can be attributed to their unequal Seebeck coefficients and internal
resistances. Meanwhile, TEG5 and TEG8 exhibit similar output values of approximately 0.1093 and
0.1115 W, respectively. This similarity results from a trade-off between their thermoelectric properties,
TEG5 has a slightly higher Seebeck coefficient (220 µV/K) but also a higher internal resistance (0.709 Ω),
while TEG8 has a slightly lower Seebeck coefficient (217.5 µV/K) but a significantly lower internal resistance
(0.442 Ω). The balance between these parameters leads to comparable power output levels. Moreover,
although TEG7 produces more power than these three modules, its output is still lower than that of TEG3,
TEG4, TEG5, and TEG8. This is attributed to its higher internal resistance, which offsets the benefits of its
relatively high Seebeck coefficient. These observations confirm that the power output of a TEG module is
influenced by the interplay between its Seebeck coefficient and internal resistance. It is worth pointing out
that the power output curve is determined by the interaction between the internal resistance of the TEG
module and the external load resistance. According to the maximum power transfer theorem, maximum
power output is achieved when the load resistance matches the internal resistance of the module.
The analysis of the electrical output power for various TEG modules highlights the critical influence of both
the Seebeck coefficient and internal resistance on overall performance. As illustrated in Figure 4B, the
output current decreases linearly with increasing output voltage, reflecting the impact of internal resistance
on the slope of the I-V characteristic. Moreover, the output current is not governed by internal resistance
alone; it is also influenced by the output voltage, which is itself a function of the Seebeck coefficient and the
temperature difference across the module. Therefore, selecting TEG materials with high Seebeck
coefficients, in conjunction with optimizing internal resistance, is essential for enhancing performance and
maximizing energy conversion efficiency.
Environmental impact related to the different TEG modules
After evaluating the CEC related to the different TEG materials, investigating its environmental impact is
required. In this section, the environmental impact, including the CO and GWP is determined and
2
presented in Figure 5A and B, respectively.