
Page 61 - Read Online
P. 61
Lekbir et al. Energy Mater. 2025, 5, 500101 https://dx.doi.org/10.20517/energymater.2025.46 Page 13 of 17
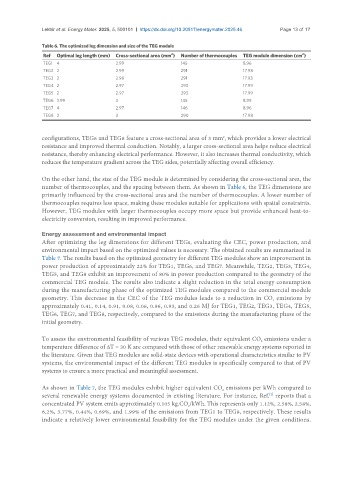
Table 6. The optimized leg dimension and size of the TEG module
Ref Optimal leg length (mm) Cross-sectional area (mm ) Number of thermocouples TEG module dimension (cm )
2
2
TEG1 4 2.99 145 8.96
TEG2 2 2.99 291 17.98
TEG3 2 2.98 291 17.93
TEG4 2 2.97 293 17.99
TEG5 2 2.97 293 17.99
TEG6 3.99 3 145 8.99
TEG7 4 2.97 146 8.96
TEG8 2 3 290 17.98
configurations, TEG6 and TEG8 feature a cross-sectional area of 3 mm , which provides a lower electrical
2
resistance and improved thermal conduction. Notably, a larger cross-sectional area helps reduce electrical
resistance, thereby enhancing electrical performance. However, it also increases thermal conductivity, which
reduces the temperature gradient across the TEG sides, potentially affecting overall efficiency.
On the other hand, the size of the TEG module is determined by considering the cross-sectional area, the
number of thermocouples, and the spacing between them. As shown in Table 6, the TEG dimensions are
primarily influenced by the cross-sectional area and the number of thermocouples. A lower number of
thermocouples requires less space, making these modules suitable for applications with spatial constraints.
However, TEG modules with larger thermocouples occupy more space but provide enhanced heat-to-
electricity conversion, resulting in improved performance.
Energy assessment and environmental impact
After optimizing the leg dimensions for different TEGs, evaluating the CEC, power production, and
environmental impact based on the optimized values is necessary. The obtained results are summarized in
Table 7. The results based on the optimized geometry for different TEG modules show an improvement in
power production of approximately 22% for TEG1, TEG6, and TEG7. Meanwhile, TEG2, TEG3, TEG4,
TEG5, and TEG8 exhibit an improvement of 80% in power production compared to the geometry of the
commercial TEG module. The results also indicate a slight reduction in the total energy consumption
during the manufacturing phase of the optimized TEG modules compared to the commercial module
geometry. This decrease in the CEC of the TEG modules leads to a reduction in CO emissions by
2
approximately 0.41, 0.14, 0.91, 0.08, 0.06, 0.96, 0.93, and 0.26 MJ for TEG1, TEG2, TEG3, TEG4, TEG5,
TEG6, TEG7, and TEG8, respectively, compared to the emissions during the manufacturing phase of the
initial geometry.
To assess the environmental feasibility of various TEG modules, their equivalent CO emissions under a
2
temperature difference of ΔT = 30 K are compared with those of other renewable energy systems reported in
the literature. Given that TEG modules are solid-state devices with operational characteristics similar to PV
systems, the environmental impact of the different TEG modules is specifically compared to that of PV
systems to ensure a more practical and meaningful assessment.
As shown in Table 7, the TEG modules exhibit higher equivalent CO emissions per kWh compared to
2
several renewable energy systems documented in existing literature. For instance, Ref. reports that a
[2]
concentrated PV system emits approximately 0.105 kg.CO /kWh. This represents only 1.12%, 2.58%, 2.58%,
2
6.2%, 3.77%, 0.44%, 0.69%, and 1.99% of the emissions from TEG1 to TEG8, respectively. These results
indicate a relatively lower environmental feasibility for the TEG modules under the given conditions.