
Page 60 - Read Online
P. 60
Page 12 of 17 Lekbir et al. Energy Mater. 2025, 5, 500101 https://dx.doi.org/10.20517/energymater.2025.46
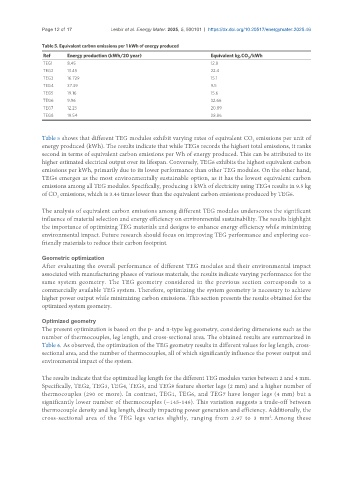
Table 5. Equivalent carbon emissions per 1 kWh of energy produced
Ref Energy production (kWh/20 year) Equivalent kg.CO /kWh
2
TEG1 8.45 12.8
TEG2 13.45 22.4
TEG3 16.729 15.1
TEG4 37.39 9.5
TEG5 19.16 15.6
TEG6 9.96 32.66
TEG7 12.23 20.89
TEG8 19.54 28.86
Table 5 shows that different TEG modules exhibit varying rates of equivalent CO emissions per unit of
2
energy produced (kWh). The results indicate that while TEG8 records the highest total emissions, it ranks
second in terms of equivalent carbon emissions per Wh of energy produced. This can be attributed to its
higher estimated electrical output over its lifespan. Conversely, TEG6 exhibits the highest equivalent carbon
emissions per kWh, primarily due to its lower performance than other TEG modules. On the other hand,
TEG4 emerges as the most environmentally sustainable option, as it has the lowest equivalent carbon
emissions among all TEG modules. Specifically, producing 1 kWh of electricity using TEG4 results in 9.5 kg
of CO emissions, which is 3.44 times lower than the equivalent carbon emissions produced by TEG6.
2
The analysis of equivalent carbon emissions among different TEG modules underscores the significant
influence of material selection and energy efficiency on environmental sustainability. The results highlight
the importance of optimizing TEG materials and designs to enhance energy efficiency while minimizing
environmental impact. Future research should focus on improving TEG performance and exploring eco-
friendly materials to reduce their carbon footprint.
Geometric optimization
After evaluating the overall performance of different TEG modules and their environmental impact
associated with manufacturing phases of various materials, the results indicate varying performance for the
same system geometry. The TEG geometry considered in the previous section corresponds to a
commercially available TEG system. Therefore, optimizing the system geometry is necessary to achieve
higher power output while minimizing carbon emissions. This section presents the results obtained for the
optimized system geometry.
Optimized geometry
The present optimization is based on the p- and n-type leg geometry, considering dimensions such as the
number of thermocouples, leg length, and cross-sectional area. The obtained results are summarized in
Table 6. As observed, the optimization of the TEG geometry results in different values for leg length, cross-
sectional area, and the number of thermocouples, all of which significantly influence the power output and
environmental impact of the system.
The results indicate that the optimized leg length for the different TEG modules varies between 2 and 4 mm.
Specifically, TEG2, TEG3, TEG4, TEG5, and TEG8 feature shorter legs (2 mm) and a higher number of
thermocouples (290 or more). In contrast, TEG1, TEG6, and TEG7 have longer legs (4 mm) but a
significantly lower number of thermocouples (~145-146). This variation suggests a trade-off between
thermocouple density and leg length, directly impacting power generation and efficiency. Additionally, the
2
cross-sectional area of the TEG legs varies slightly, ranging from 2.97 to 3 mm . Among these