
Page 56 - Read Online
P. 56
Page 8 of 17 Lekbir et al. Energy Mater. 2025, 5, 500101 https://dx.doi.org/10.20517/energymater.2025.46
Table 3. Equivalent CEC for each TEG module
Ref Leg Equivalent EI for leg materials Material density Leg weight CEC for leg CEC for TEG module
i
3
(MJ/kg) (g/cm ) (g) (MJ/leg) (MJ)
TEG1 n-type 151.82 2.43 0.0330 5.02 1284.38
p-type 151.82 2.43 0.0330 5.02
TEG2 n-type 141.2 7.64 0.1039 14.67 3567.34
p-type 143.76 6.75 0.0918 13.2
TEG3 n-type 144.6 5.26 0.0715 10.34 2991.05
p-type 143.77 6.66 0.0906 13.02
TEG4 n-type 150 8.64 0.1175 17.63 4186.6
p-type 136.9 8.10 0.1102 15.08
TEG5 n-type 143.74 7.7 0.1047 15.05 3531.28
p-type 143.78 6.41 0.0872 12.53
TEG6 n-type 143.74 7.7 0.1047 15.05 3853.44
p-type 143.74 7.7 0.1047 15.05
TEG7 n-type 132.05 6.93 0.0942 12.45 3025.62
p-type 119.82 6.87 0.0934 11.2
TEG8 n-type 464.96 3.92 0.0533 24.79 6681.54
p-type 214.41 9.4 0.1278 27.41
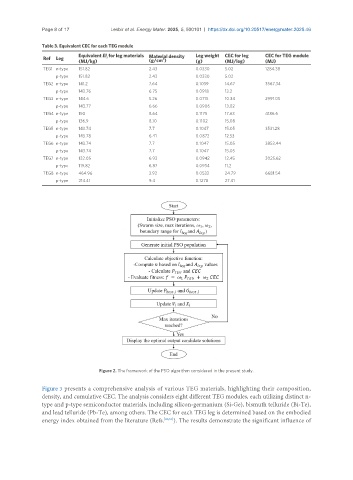
Figure 2. The framework of the PSO algorithm considered in the present study.
Figure 3 presents a comprehensive analysis of various TEG materials, highlighting their composition,
density, and cumulative CEC. The analysis considers eight different TEG modules, each utilizing distinct n-
type and p-type semiconductor materials, including silicon-germanium (Si-Ge), bismuth telluride (Bi-Te),
and lead telluride (Pb-Te), among others. The CEC for each TEG leg is determined based on the embodied
energy index obtained from the literature (Refs. [20,51] ). The results demonstrate the significant influence of