
Page 59 - Read Online
P. 59
Lekbir et al. Energy Mater. 2025, 5, 500101 https://dx.doi.org/10.20517/energymater.2025.46 Page 11 of 17
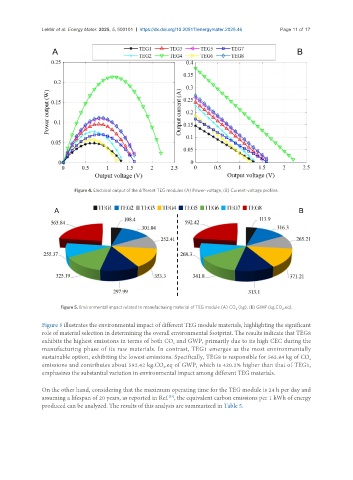
Figure 4. Electrical output of the different TEG modules (A) Power-voltage, (B) Current-voltage profiles.
Figure 5. Environmental impact related to manufacturing material of TEG module (A) CO (kg), (B) GWP (kg.CO .eq).
2
2
Figure 5 illustrates the environmental impact of different TEG module materials, highlighting the significant
role of material selection in determining the overall environmental footprint. The results indicate that TEG8
exhibits the highest emissions in terms of both CO and GWP, primarily due to its high CEC during the
2
manufacturing phase of its raw materials. In contrast, TEG1 emerges as the most environmentally
sustainable option, exhibiting the lowest emissions. Specifically, TEG8 is responsible for 563.84 kg of CO
2
emissions and contributes about 592.42 kg.CO .eq of GWP, which is 420.2% higher than that of TEG1,
2
emphasizes the substantial variation in environmental impact among different TEG materials.
On the other hand, considering that the maximum operating time for the TEG module is 24 h per day and
assuming a lifespan of 20 years, as reported in Ref. , the equivalent carbon emissions per 1 kWh of energy
[54]
produced can be analyzed. The results of this analysis are summarized in Table 5.