Page 103 - Read Online
P. 103

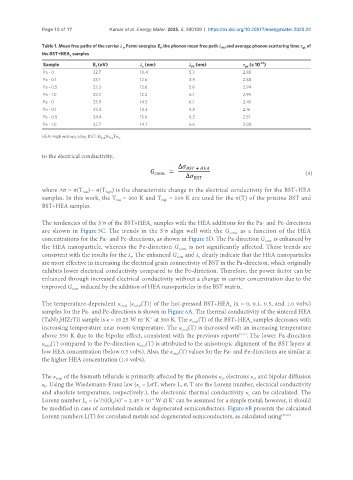
Page 10 of 17          Kumar et al. Energy Mater. 2025, 5, 500109  https://dx.doi.org/10.20517/energymater.2025.22

               Table 1. Mean free paths of the carrier λ , Fermi energies E , the phonon mean free path λ , and average phonon scattering time τ  of
                                                                            Ph
                                                                                                       ph
                                          e
                                                       F
               the BST+HEA  samples
                         x
                Sample          E  (eV)         λ  (nm)          λ  (nm)           τ  (s 10 )
                                                                                         -12
                                                 e
                                                                                    ph
                                 f
                                                                 Ph
                Pa - 0          32.7            10.4             5.3               2.88
                Pa - 0.1        33.1            12.6             4.9               2.88
                Pa - 0.5        33.3            13.6             5.6               2.94
                Pa - 1.0        33.3            12.3             6.1               2.95
                Pe - 0          33.9            14.5             6.1               2.49
                Pe - 0.1        33.4            14.4             5.8               2.16
                Pe - 0.5        34.4            13.6             6.3               2.51
                Pe - 1.0        33.7            14.7             6.6               3.08
               HEA: High entropy alloy; BST: Bi Sb Te .
                                   0.4  1.6  3
               to the electrical conductivity,


                                                                                                        (3)

               where Δσ = σ(T ) - σ(T ) is the characteristic change in the electrical conductivity for the BST+HEA
                                     high
                             low
               samples. In this work, the T  = 300 K and T  = 500 K are used for the σ(T) of the pristine BST and
                                                       high
                                        low
               BST+HEA samples.
               The tendencies of the S σ of the BST+HEA  samples with the HEA additions for the Pa- and Pe-directions
                                   2
                                                    x
                                                        2
               are shown in Figure 5C. The trends in the S σ align well with the G conn.  as a function of the HEA
               concentrations for the Pa- and Pe-directions, as shown in Figure 5D. The Pa-direction G  is enhanced by
                                                                                          conn.
               the HEA nanoparticle, whereas the Pe-direction G conn.  is not significantly affected. These trends are
               consistent with the results for the λ . The enhanced G  and λ  clearly indicate that the HEA nanoparticles
                                                                    e
                                             e
                                                             conn
               are more effective in increasing the electrical grain connectivity of BST in the Pa-direction, which originally
               exhibits lower electrical conductivity compared to the Pe-direction. Therefore, the power factor can be
               enhanced through increased electrical conductivity without a change in carrier concentration due to the
               improved G  induced by the addition of HEA nanoparticles in the BST matrix.
                         conn.
               The temperature-dependent κ  [κ (T)] of the hot-pressed BST+HEA  (x = 0, 0.1, 0.5, and 1.0 vol%)
                                          total
                                                                               x
                                              total
               samples for the Pa- and Pe-directions is shown in Figure 6A. The thermal conductivity of the sintered HEA
               (TaNb HfZrTi) sample is κ = 10.25 W m K  at 300 K. The κ (T) of the BST+HEA  samples decreases with
                                                    -1
                                                 -1
                                                                                     x
                                                                  total
                     2
               increasing temperature near room temperature. The κ (T) is increased with an increasing temperature
                                                              total
               above 350 K due to the bipolar effect, consistent with the previous reports [9,11] . The lower Pa-direction
               κ (T) compared to the Pe-direction κ (T) is attributed to the anisotropic alignment of the BST layers at
                total
                                                total
               low HEA concentration (below 0.5 vol%). Also, the κ (T) values for the Pa- and Pe-directions are similar at
                                                           total
               the higher HEA concentration (1.0 vol%).
               The κ  of the bismuth telluride is primarily affected by the phonons κ , electrons κ , and bipolar diffusion
                                                                            L
                    total
                                                                                      e
               κ . Using the Wiedemann-Franz law (κ  = LσT, where L, σ, T are the Lorenz number, electrical conductivity
                b
                                                e
               and absolute temperature, respectively.), the electronic thermal conductivity κ  can be calculated. The
                                                                                     e
               Lorenz number L  = (π /3)(k /e)  = 2.45 × 10  W Ω K  can be assumed for a simple metal; however, it should
                                                           2
                                          2
                                                    -8
                                  2
                                       B
                              0
               be modified in case of correlated metals or degenerated semiconductors. Figure 6B presents the calculated
               Lorenz numbers L(T) for correlated metals and degenerated semiconductors, as calculated using [38,39]
   98   99   100   101   102   103   104   105   106   107   108