
Page 106 - Read Online
P. 106
Kumar et al. Energy Mater. 2025, 5, 500109 https://dx.doi.org/10.20517/energymater.2025.22 Page 13 of 17
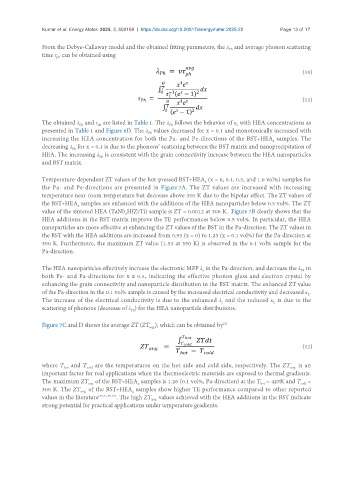
From the Debye-Callaway model and the obtained fitting parameters, the λ and average phonon scattering
Ph
time τ can be obtained using
ph
(10)
(11)
The obtained λ and τ are listed in Table 1. The λ follows the behavior of κ with HEA concentrations as
Ph
ph
Ph
L
presented in Table 1 and Figure 6D. The λ values decreased for x = 0.1 and monotonically increased with
Ph
increasing the HEA concentration for both the Pa- and Pe-directions of the BST+HEA samples. The
x
decreasing λ for x = 0.1 is due to the phonons’ scattering between the BST matrix and nanoprecipitation of
Ph
HEA. The increasing λ is consistent with the grain connectivity increase between the HEA nanoparticles
Ph
and BST matrix.
Temperature-dependent ZT values of the hot-pressed BST+HEA (x = 0, 0.1, 0.5, and 1.0 vol%) samples for
x
the Pa- and Pe-directions are presented in Figure 7A. The ZT values are increased with increasing
temperature near room temperature but decrease above 350 K due to the bipolar effect. The ZT values of
the BST+HEA samples are enhanced with the additions of the HEA nanoparticles below 0.5 vol%. The ZT
x
value of the sintered HEA (TaNb HfZrTi) sample is ZT = 0.0012 at 300 K. Figure 7B clearly shows that the
2
HEA additions in the BST matrix improve the TE performances below 0.5 vol%. In particular, the HEA
nanoparticles are more effective at enhancing the ZT values of the BST in the Pa-direction. The ZT values in
the BST with the HEA additions are increased from 0.93 (x = 0) to 1.23 (x = 0.1 vol%) for the Pa-direction at
300 K. Furthermore, the maximum ZT value (1.33 at 350 K) is observed in the 0.1 vol% sample for the
Pa-direction.
The HEA nanoparticles effectively increase the electronic MFP λ in the Pa-direction, and decrease the λ in
e
Ph
both Pe- and Pa-directions for x ≤ 0.5, indicating the effective phonon glass and electron crystal by
enhancing the grain connectivity and nanoparticle distribution in the BST matrix. The enhanced ZT value
of the Pa-direction in the 0.1 vol% sample is caused by the increased electrical conductivity and decreased κ .
L
The increase of the electrical conductivity is due to the enhanced λ and the reduced κ is due to the
e
L
scattering of phonons (decrease of λ ) for the HEA nanoparticle distributions.
Ph
Figure 7C and D shows the average ZT (ZT ), which can be obtained by [3]
avg.
(12)
where T and T are the temperatures on the hot side and cold side, respectively. The ZT is an
cold
avg.
hot
important factor for real applications when the thermoelectric materials are exposed to thermal gradients.
The maximum ZT of the BST+HEA samples is 1.26 (0.1 vol%, Pa-direction) at the T = 425K and T =
x
cold
hot
avg.
300 K. The ZT of the BST+HEA samples show higher TE performance compared to other reported
avg.
x
values in the literature [37,41,45-51] . The high ZT values achieved with the HEA additions in the BST indicate
avg.
strong potential for practical applications under temperature gradients.