
Page 101 - Read Online
P. 101
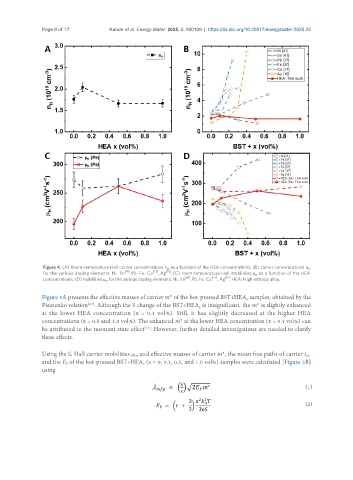
Page 8 of 17           Kumar et al. Energy Mater. 2025, 5, 500109  https://dx.doi.org/10.20517/energymater.2025.22


                Figure 4. (A) Room-temperature Hall carrier concentrations n  as a function of the HEA concentrations; (B) carrier concentrations n
                                                         H                                               H
                                           [41]      [37]  [10]
                for the various doping elements: Ni,  Sn  , Pb, Fe,  Co  , Ag  ; (C) room-temperature Hall mobilities μ  as a function of the HEA
                                                                                       H
                concentrations; (D) mobilities μ  for the various doping elements: Ni, Sn [41] , Pb, Fe, Co [37] , Ag [10] . HEA: High entropy alloy.
                                     H
               Figure 5A presents the effective masses of carrier m* of the hot-pressed BST+HEA  samples, obtained by the
                                                                                    x
               Pisarenko relation . Although the S change of the BST+HEA  is insignificant, the m* is slightly enhanced
                               [2,5]
                                                                    x
               at the lower HEA concentration (x = 0.1 vol%). Still, it has slightly decreased at the higher HEA
               concentrations (x = 0.5 and 1.0 vol%). The enhanced m* at the lower HEA concentration (x = 0.1 vol%) can
               be attributed to the resonant state effect . However, further detailed investigations are needed to clarify
                                                  [2,5]
               these effects.
               Using the S, Hall carrier mobilities μ , and effective masses of carrier m*, the mean free paths of carrier λ ,
                                                                                                        e
                                              H
               and the E  of the hot-pressed BST+HEA  (x = 0, 0.1, 0.5, and 1.0 vol%) samples were calculated [Figure 5B]
                       F
                                                 x
               using
                                                                                                        (1)

                                                                                                        (2)