
Page 98 - Read Online
P. 98
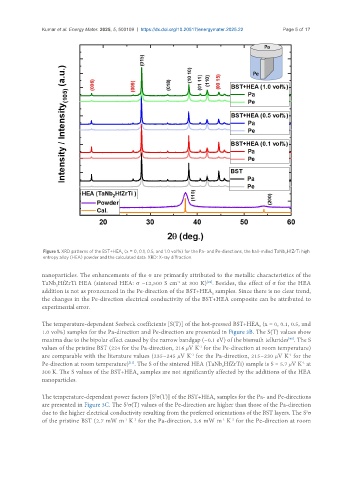
Kumar et al. Energy Mater. 2025, 5, 500109  https://dx.doi.org/10.20517/energymater.2025.22  Page 5 of 17


                Figure 1. XRD patterns of the BST+HEA  (x = 0, 0.1, 0.5, and 1.0 vol%) for the Pa- and Pe-directions, the ball-milled TaNb HfZrTi high
                                          x
                                                                                                 2
                entropy alloy (HEA) powder and the calculated data. XRD: X-ray diffraction.
               nanoparticles. The enhancements of the σ are primarily attributed to the metallic characteristics of the
               TaNb HfZrTi HEA (sintered HEA: σ ~12,500 S cm  at 300 K) . Besides, the effect of σ for the HEA
                                                                       [24]
                                                             -1
                    2
               addition is not as pronounced in the Pe-direction of the BST+HEA  samples. Since there is no clear trend,
                                                                         x
               the changes in the Pe-direction electrical conductivity of the BST+HEA composite can be attributed to
               experimental error.
               The temperature-dependent Seebeck coefficients [S(T)] of the hot-pressed BST+HEA  (x = 0, 0.1, 0.5, and
                                                                                        x
               1.0 vol%) samples for the Pa-direction and Pe-direction are presented in Figure 3B. The S(T) values show
               maxima due to the bipolar effect caused by the narrow bandgap (~0.1 eV) of the bismuth tellurides . The S
                                                                                                  [40]
                                                                    -1
               values of the pristine BST (224 for the Pa-direction, 216 μV K  for the Pe-direction at room temperature)
                                                                 -1
                                                                                                  -1
               are comparable with the literature values (235~245 μV K  for the Pa-direction, 215~230 μV K  for the
               Pe-direction at room temperature) . The S of the sintered HEA (TaNb HfZrTi) sample is S = 5.7 μV K  at
                                            [11]
                                                                                                       -1
                                                                            2
               300 K. The S values of the BST+HEA  samples are not significantly affected by the additions of the HEA
                                               x
               nanoparticles.
               The temperature-dependent power factors [S σ(T)] of the BST+HEA  samples for the Pa- and Pe-directions
                                                     2
                                                                         x
                                            2
               are presented in Figure 3C. The S σ(T) values of the Pe-direction are higher than those of the Pa-direction
                                                                                                        2
               due to the higher electrical conductivity resulting from the preferred orientations of the BST layers. The S σ
               of the pristine BST (2.7 mW m  K  for the Pa-direction, 3.6 mW m  K  for the Pe-direction at room
                                                                            -1
                                              -2
                                           -1
                                                                               -2