
Page 99 - Read Online
P. 99
Page 6 of 17 Kumar et al. Energy Mater. 2025, 5, 500109 https://dx.doi.org/10.20517/energymater.2025.22
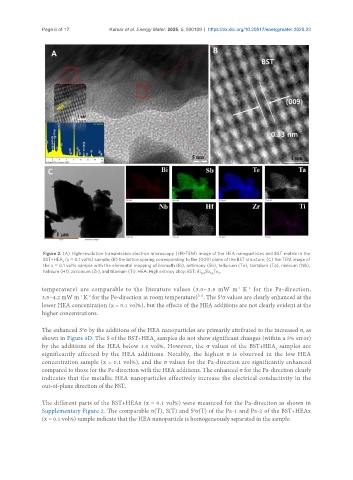
Figure 2. (A) High-resolution transmission electron microscopy (HR-TEM) image of the HEA nanoparticles and BST matrix in the
BST+HEA (x = 0.1 vol%) sample; (B) the lattice sparing corresponding to the (009) plane of the BST structure; (C) the TEM image of
x
the x = 0.1 vol% sample with the elemental mapping of bismuth (Bi), antimony (Sb), tellurium (Te), tantalum (Ta), niobium (Nb),
hafnium (Hf), zirconium (Zr), and titanium (Ti). HEA: High entropy alloy; BST: Bi Sb Te .
0.4 1.6 3
temperature) are comparable to the literature values (3.0~3.6 mW m K for the Pa-direction,
-1
-2
-1
-2
[11]
2
3.5~4.2 mW m K for the Pe-direction at room temperature) . The S σ values are clearly enhanced at the
lower HEA concentration (x = 0.1 vol%), but the effects of the HEA additions are not clearly evident at the
higher concentrations.
The enhanced S σ by the additions of the HEA nanoparticles are primarily attributed to the increased σ, as
2
shown in Figure 3D. The S of the BST+HEA samples do not show significant changes (within a 5% error)
x
by the additions of the HEA below 1.0 vol%. However, the σ values of the BST+HEA samples are
x
significantly affected by the HEA additions. Notably, the highest σ is observed in the low HEA
concentration sample (x = 0.1 vol%), and the σ values for the Pa-direction are significantly enhanced
compared to those for the Pe-direction with the HEA additions. The enhanced σ for the Pa-direction clearly
indicates that the metallic HEA nanoparticles effectively increase the electrical conductivity in the
out-of-plane direction of the BST.
The different parts of the BST+HEAx (x = 0.1 vol%) were measured for the Pa-direction as shown in
Supplementary Figure 2. The comparable σ(T), S(T) and S σ(T) of the Pa-1 and Pa-2 of the BST+HEAx
2
(x = 0.1 vol%) sample indicate that the HEA nanoparticle is homogeneously separated in the sample.