
Page 178 - Read Online
P. 178
Page 10 of 16 Li et al. Energy Mater 2023;3:300021 https://dx.doi.org/10.20517/energymater.2023.09
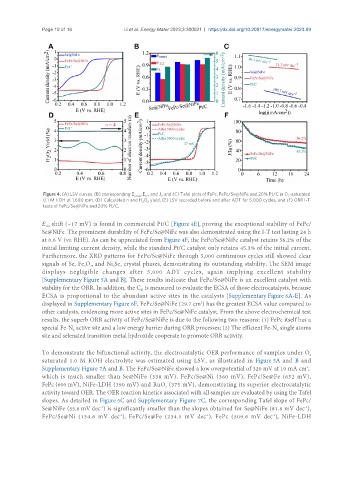
Figure 4. (A) LSV curves, (B) corresponding E , E and J , and (C) Tafel plots of FePc, FePc/Se@NiFe and 20% Pt/C in O -saturated
onset 1/2 L 2
0.1 M KOH at 1,600 rpm, (D) Calculated n and H O yield, (E) LSV recorded before and after ADT for 5,000 cycles, and (F) ORR I-T
2 2
tests of FePc/Se@NiFe and 20% Pt/C.
E shift (~17 mV) is found in commercial Pt/C [Figure 4E], proving the exceptional stability of FePc/
1/2
Se@NiFe. The prominent durability of FePc/Se@NiFe was also demonstrated using the I-T test lasting 24 h
at 0.6 V (vs. RHE). As can be appreciated from Figure 4F, the FePc/Se@NiFe catalyst retains 56.2% of the
initial limiting current density, while the standard Pt/C catalyst only retains 45.3% of the initial current.
Furthermore, the XRD patterns for FePc/Se@NiFe through 5,000 continuous cycles still showed clear
signals of Se, Fe O , and Ni Se crystal phases, demonstrating its outstanding stability. The SEM image
3
4
3
4
displays negligible changes after 5,000 ADT cycles, again implying excellent stability
[Supplementary Figure 5A and B]. These results indicate that FePc/Se@NiFe is an excellent catalyst with
stability for the ORR. In addition, the C is measured to evaluate the ECSA of those electrocatalysts, because
dl
ECSA is proportional to the abundant active sites in the catalysts [Supplementary Figure 6A-E]. As
displayed in Supplementary Figure 6F, FePc/Se@NiFe (29.7 cm ) has the greatest ECSA value compared to
2
other catalysts, evidencing more active sites in FePc/Se@NiFe catalyst. From the above electrochemical test
results, the superb ORR activity of FePc/Se@NiFe is due to the following two reasons: (1) FePc itself has a
special Fe-N active site and a low energy barrier during ORR processes; (2) The efficient Fe-N single atoms
4
4
site and selenated transition metal hydroxide cooperate to promote ORR activity.
To demonstrate the bifunctional activity, the electrocatalytic OER performance of samples under O
2
saturated 1.0 M KOH electrolyte was estimated using LSV, as illustrated in Figure 5A and B and
Supplementary Figure 7A and B. The FePc/Se@NiFe showed a low overpotential of 320 mV at 10 mA cm ,
2
which is much smaller than Se@NiFe (338 mV), FePc/Se@Ni (360 mV), FePc/Se@Fe (652 mV),
FePc (600 mV), NiFe-LDH (390 mV) and RuO (375 mV), demonstrating its superior electrocatalytic
2
activity toward OER. The OER reaction kinetics associated with all samples are evaluated by using the Tafel
slopes. As detailed in Figure 5C and Supplementary Figure 7C, the corresponding Tafel slope of FePc/
-1
-1
Se@NiFe (55.6 mV dec ) is significantly smaller than the slopes obtained for Se@NiFe (81.8 mV dec ),
FePc/Se@Ni (134.6 mV dec ), FePc/Se@Fe (234.5 mV dec ), FePc (509.6 mV dec ), NiFe-LDH
-1
-1
-1