
Page 177 - Read Online
P. 177
Li et al. Energy Mater 2023;3:300021 https://dx.doi.org/10.20517/energymater.2023.09 Page 9 of 16
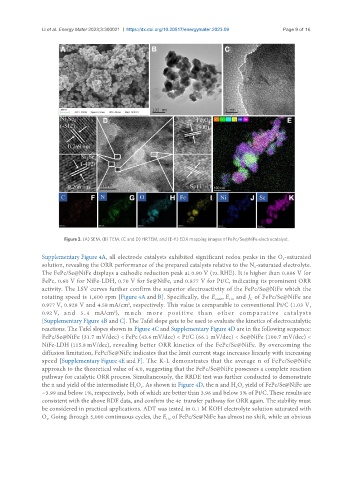
Figure 3. (A) SEM, (B) TEM, (C and D) HRTEM, and (E-K) EDX mapping images of FePc/Se@NiFe electrocatalyst.
Supplementary Figure 4A, all electrode catalysts exhibited significant redox peaks in the O -saturated
2
solution, revealing the ORR performance of the prepared catalysts relative to the N -saturated electrolyte.
2
The FePc/Se@NiFe displays a cathodic reduction peak at 0.90 V (vs. RHE). It is higher than 0.886 V for
FePc, 0.60 V for NiFe-LDH, 0.70 V for Se@NiFe, and 0.877 V for Pt/C, indicating its prominent ORR
activity. The LSV curves further confirm the superior electroactivity of the FePc/Se@NiFe which the
rotating speed is 1,600 rpm [Figure 4A and B]. Specifically, the E , E and J of FePc/Se@NiFe are
onset
1/2
L
0.977 V, 0.928 V and 4.58 mA/cm , respectively. This value is comparable to conventional Pt/C (1.03 V,
2
,
0.92 V, a n d 5 . 4 mA/cm ) m u c h m o r e p o s i t i v e t h a n o t h e r c o m p a r a t i v e c a t a l y s t s
2
[Supplementary Figure 4B and C]. The Tafel slope gets to be used to evaluate the kinetics of electrocatalytic
reactions. The Tafel slopes shown in Figure 4C and Supplementary Figure 4D are in the following sequence:
FePc/Se@NiFe (31.7 mV/dec) < FePc (43.6 mV/dec) < Pt/C (66.1 mV/dec) < Se@NiFe (100.7 mV/dec) <
NiFe-LDH (115.8 mV/dec), revealing better ORR kinetics of the FePc/Se@NiFe. By overcoming the
diffusion limitation, FePc/Se@NiFe indicates that the limit current stage increases linearly with increasing
speed [Supplementary Figure 4E and F]. The K-L demonstrates that the average n of FePc/Se@NiFe
approach to the theoretical value of 4.0, suggesting that the FePc/Se@NiFe possesses a complete reaction
pathway for catalytic ORR process. Simultaneously, the RRDE test was further conducted to demonstrate
the n and yield of the intermediate H O . As shown in Figure 4D, the n and H O yield of FePc/Se@NiFe are
2
2
2
2
~3.99 and below 1%, respectively, both of which are better than 3.96 and below 3% of Pt/C. These results are
consistent with the above RDE data, and confirm the 4e transfer pathway for ORR again. The stability must
-
be considered in practical applications. ADT was tested in 0.1 M KOH electrolyte solution saturated with
O . Going through 5,000 continuous cycles, the E of FePc/Se@NiFe has almost no shift, while an obvious
1/2
2