
Page 108 - Read Online
P. 108
Page 14 of 26 Li et al. Cancer Drug Resist. 2025;8:31
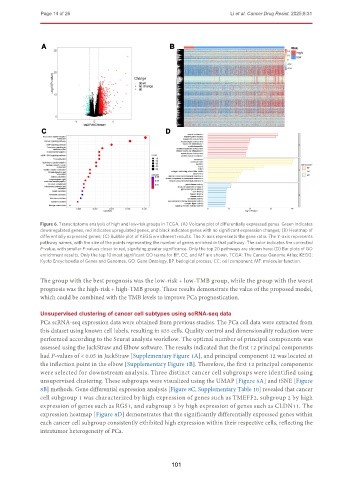
Figure 6. Transcriptome analysis of high and low-risk groups in TCGA. (A) Volcano plot of differentially expressed genes. Green indicates
downregulated genes, red indicates upregulated genes, and black indicates genes with no significant expression changes; (B) Heatmap of
differentially expressed genes; (C) Bubble plot of KEGG enrichment results. The X-axis represents the gene ratio. The Y-axis represents
pathway names, with the size of the points representing the number of genes enriched in that pathway. The color indicates the corrected
P-value, with smaller P-values closer to red, signifying greater significance. Only the top 20 pathways are shown here; (D) Bar plots of GO
enrichment results. Only the top 10 most significant GO terms for BP, CC, and MF are shown. TCGA: The Cancer Genome Atlas; KEGG:
Kyoto Encyclopedia of Genes and Genomes; GO: Gene Ontology; BP: biological process; CC: cell component; MF: molecular function.
The group with the best prognosis was the low-risk + low-TMB group, while the group with the worst
prognosis was the high-risk + high-TMB group. These results demonstrate the value of the proposed model,
which could be combined with the TMB levels to improve PCa prognostication.
Unsupervised clustering of cancer cell subtypes using scRNA-seq data
PCa scRNA-seq expression data were obtained from previous studies. The PCa cell data were extracted from
this dataset using known cell labels, resulting in 835 cells. Quality control and dimensionality reduction were
performed according to the Seurat analysis workflow. The optimal number of principal components was
assessed using the JackStraw and Elbow software. The results indicated that the first 12 principal components
had P-values of < 0.05 in JackStraw [Supplementary Figure 1A], and principal component 12 was located at
the inflection point in the elbow [Supplementary Figure 1B]. Therefore, the first 12 principal components
were selected for downstream analysis. Three distinct cancer cell subgroups were identified using
unsupervised clustering. These subgroups were visualized using the UMAP [Figure 8A] and tSNE [Figure
8B] methods. Gene differential expression analysis [Figure 8C, Supplementary Table 10] revealed that cancer
cell subgroup 1 was characterized by high expression of genes such as TMEFF2, subgroup 2 by high
expression of genes such as RGS1, and subgroup 3 by high expression of genes such as CLDN11. The
expression heatmap [Figure 8D] demonstrates that the significantly differentially expressed genes within
each cancer cell subgroup consistently exhibited high expression within their respective cells, reflecting the
intratumor heterogeneity of PCa.
101