
Page 111 - Read Online
P. 111
Li et al. Cancer Drug Resist. 2025;8:31 Page 17 of 26
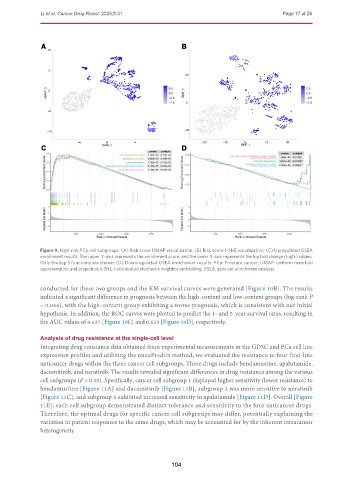
Figure 9. High-risk PCa cell subgroups. (A) Risk score UMAP visualization; (B) Risk score t-SNE visualization; (C) Upregulated GSEA
enrichment results. The upper Y-axis represents the enrichment score, and the lower Y-axis represents the log fold change (logfc) values.
Only the top 5 functions are shown; (D) Downregulated GSEA enrichment results. PCa: Prostate cancer; UMAP: uniform manifold
approximation and projection; t-SNE: t-distributed stochastic neighbor embedding; GSEA: gene set enrichment analysis.
conducted for these two groups and the KM survival curves were generated [Figure 10B]. The results
indicated a significant difference in prognosis between the high-content and low-content groups (log-rank P
= 0.044), with the high-content group exhibiting a worse prognosis, which is consistent with our initial
hypothesis. In addition, the ROC curves were plotted to predict the 1- and 5-year survival rates, resulting in
the AUC values of 0.637 [Figure 10C] and 0.623 [Figure 10D], respectively.
Analysis of drug resistance at the single-cell level
Integrating drug resistance data obtained from experimental measurements in the GDSC and PCa cell line
expression profiles and utilizing the oncoPredict method, we evaluated the resistance to four first-line
anticancer drugs within the three cancer cell subgroups. These drugs include bendamustine, apalutamide,
dacomitinib, and neratinib. The results revealed significant differences in drug resistance among the various
cell subgroups (P < 0.05). Specifically, cancer cell subgroup 1 displayed higher sensitivity (lower resistance) to
bendamustine [Figure 11A] and dacomitinib [Figure 11B], subgroup 2 was more sensitive to neratinib
[Figure 11C], and subgroup 3 exhibited increased sensitivity to apalutamide [Figure 11D]. Overall [Figure
11E], each cell subgroup demonstrated distinct tolerance and sensitivity to the four anticancer drugs.
Therefore, the optimal drugs for specific cancer cell subgroups may differ, potentially explaining the
variation in patient responses to the same drugs, which may be accounted for by the inherent intratumor
heterogeneity.
104