
Page 109 - Read Online
P. 109
Li et al. Cancer Drug Resist. 2025;8:31 Page 15 of 26
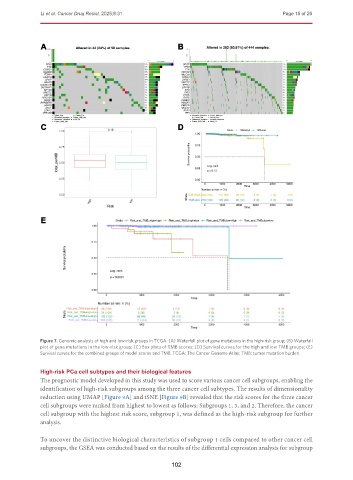
Figure 7. Genomic analysis of high and low-risk groups in TCGA. (A) Waterfall plot of gene mutations in the high-risk group; (B) Waterfall
plot of gene mutations in the low-risk group; (C) Box plots of TMB scores; (D) Survival curves for the high and low TMB groups; (E)
Survival curves for the combined groups of model scores and TMB. TCGA: The Cancer Genome Atlas; TMB: tumor mutation burden.
High-risk PCa cell subtypes and their biological features
The prognostic model developed in this study was used to score various cancer cell subgroups, enabling the
identification of high-risk subgroups among the three cancer cell subtypes. The results of dimensionality
reduction using UMAP [Figure 9A] and tSNE [Figure 9B] revealed that the risk scores for the three cancer
cell subgroups were ranked from highest to lowest as follows: Subgroups 1, 3, and 2. Therefore, the cancer
cell subgroup with the highest risk score, subgroup 1, was defined as the high-risk subgroup for further
analysis.
To uncover the distinctive biological characteristics of subgroup 1 cells compared to other cancer cell
subgroups, the GSEA was conducted based on the results of the differential expression analysis for subgroup
102