
Page 110 - Read Online
P. 110
Page 16 of 26 Li et al. Cancer Drug Resist. 2025;8:31
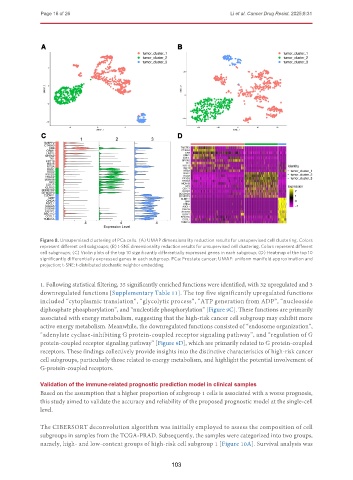
Figure 8. Unsupervised clustering of PCa cells. (A) UMAP dimensionality reduction results for unsupervised cell clustering. Colors
represent different cell subgroups; (B) t-SNE dimensionality reduction results for unsupervised cell clustering. Colors represent different
cell subgroups; (C) Violin plots of the top 10 significantly differentially expressed genes in each subgroup; (D) Heatmap of the top 10
significantly differentially expressed genes in each subgroup. PCa: Prostate cancer; UMAP: uniform manifold approximation and
projection; t-SNE: t-distributed stochastic neighbor embedding.
1. Following statistical filtering, 35 significantly enriched functions were identified, with 32 upregulated and 3
downregulated functions [Supplementary Table 11]. The top five significantly upregulated functions
included “cytoplasmic translation”, “glycolytic process”, “ATP generation from ADP”, “nucleoside
diphosphate phosphorylation”, and “nucleotide phosphorylation” [Figure 9C]. These functions are primarily
associated with energy metabolism, suggesting that the high-risk cancer cell subgroup may exhibit more
active energy metabolism. Meanwhile, the downregulated functions consisted of “endosome organization”,
“adenylate cyclase-inhibiting G protein-coupled receptor signaling pathway”, and “regulation of G
protein-coupled receptor signaling pathway” [Figure 9D], which are primarily related to G protein-coupled
receptors. These findings collectively provide insights into the distinctive characteristics of high-risk cancer
cell subgroups, particularly those related to energy metabolism, and highlight the potential involvement of
G-protein-coupled receptors.
Validation of the immune-related prognostic prediction model in clinical samples
Based on the assumption that a higher proportion of subgroup 1 cells is associated with a worse prognosis,
this study aimed to validate the accuracy and reliability of the proposed prognostic model at the single-cell
level.
The CIBERSORT deconvolution algorithm was initially employed to assess the composition of cell
subgroups in samples from the TCGA-PRAD. Subsequently, the samples were categorized into two groups,
namely, high- and low-content groups of high-risk cell subgroup 1 [Figure 10A]. Survival analysis was
103