
Page 112 - Read Online
P. 112
Page 18 of 26 Li et al. Cancer Drug Resist. 2025;8:31
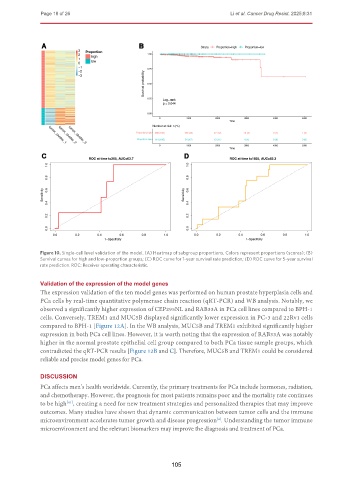
Figure 10. Single-cell level validation of the model. (A) Heatmap of subgroup proportions. Colors represent proportions (scores); (B)
Survival curves for high and low-proportion groups; (C) ROC curve for 1-year survival rate prediction; (D) ROC curve for 5-year survival
rate prediction. ROC: Receiver operating characteristic.
Validation of the expression of the model genes
The expression validation of the ten model genes was performed on human prostate hyperplasia cells and
PCa cells by real-time quantitative polymerase chain reaction (qRT-PCR) and WB analysis. Notably, we
observed a significantly higher expression of CEP295NL and RAB33A in PCa cell lines compared to BPH-1
cells. Conversely, TREM1 and MUC5B displayed significantly lower expression in PC-3 and 22Rv1 cells
compared to BPH-1 [Figure 12A]. In the WB analysis, MUC5B and TREM1 exhibited significantly higher
expression in both PCa cell lines. However, it is worth noting that the expression of RAB33A was notably
higher in the normal prostate epithelial cell group compared to both PCa tissue sample groups, which
contradicted the qRT-PCR results [Figure 12B and C]. Therefore, MUC5B and TREM1 could be considered
reliable and precise model genes for PCa.
DISCUSSION
PCa affects men’s health worldwide. Currently, the primary treatments for PCa include hormones, radiation,
and chemotherapy. However, the prognosis for most patients remains poor and the mortality rate continues
to be high , creating a need for new treatment strategies and personalized therapies that may improve
[41]
outcomes. Many studies have shown that dynamic communication between tumor cells and the immune
microenvironment accelerates tumor growth and disease progression . Understanding the tumor immune
[4]
microenvironment and the relevant biomarkers may improve the diagnosis and treatment of PCa.
105