
Page 113 - Read Online
P. 113
Li et al. Cancer Drug Resist. 2025;8:31 Page 19 of 26
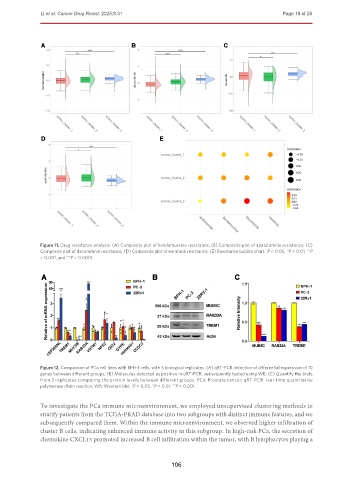
Figure 11. Drug resistance analysis. (A) Composite plot of bendamustine resistance; (B) Composite plot of apalutamide resistance; (C)
Composite plot of dacomitinib resistance; (D) Composite plot of neratinib resistance; (E) Resistance bubble chart. P < 0.05, P < 0.01, P
**
***
*
< 0.001, and P < 0.0001.
****
Figure 12. Comparison of PCa cell lines with BPH-1 cells, with 3 biological replicates. (A) qRT-PCR detection of differential expression of 10
genes between different groups; (B) Molecules detected as positive in qRT-PCR, subsequently tested using WB; (C) Quantify the blots
from 3 replicates comparing the protein levels between different groups. PCa: Prostate cancer; qRT-PCR: real-time quantitative
polymerase chain reaction; WB: Western blot. P < 0.05, P < 0.01, P < 0.001.
*
***
**
To investigate the PCa immune microenvironment, we employed unsupervised clustering methods to
stratify patients from the TCGA-PRAD database into two subgroups with distinct immune features, and we
subsequently compared them. Within the immune microenvironment, we observed higher infiltration of
cluster B cells, indicating enhanced immune activity in this subgroup. In high-risk PCa, the secretion of
chemokine CXCL13 promoted increased B cell infiltration within the tumor, with B lymphocytes playing a
106