
Page 105 - Read Online
P. 105
Li et al. Cancer Drug Resist. 2025;8:31 Page 11 of 26
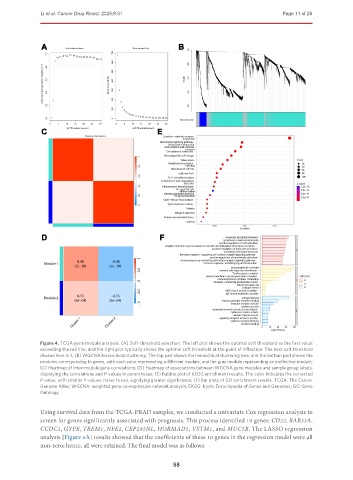
Figure 4. TCGA gene module analysis. (A) Soft-threshold selection. The left plot shows the optimal soft threshold as the first value
exceeding the red line, and the right plot typically shows the optimal soft threshold at the point of inflection. The best soft threshold
chosen here is 3; (B) WGCNA hierarchical clustering. The top part shows the hierarchical clustering tree, and the bottom part shows the
modules corresponding to genes, with each color representing a different module, and the gray module representing an ineffective module;
(C) Heatmap of inter-module gene correlations; (D) Heatmap of associations between WGCNA gene modules and sample group labels,
displaying the correlations and P-values in parentheses; (E) Bubble plot of KEGG enrichment results. The color indicates the corrected
P-value, with smaller P-values closer to red, signifying greater significance; (F) Bar plots of GO enrichment results. TCGA: The Cancer
Genome Atlas; WGCNA: weighted gene co-expression network analysis; EKGG: Kyoto Encyclopedia of Genes and Genomes; GO: Gene
Ontology.
Using survival data from the TCGA-PRAD samples, we conducted a univariate Cox regression analysis to
screen for genes significantly associated with prognosis. This process identified 10 genes: CD22, RAB33A,
CCDC3, GYPE, TREM1, NFE2, CEP295NL, HORMAD1, VSTM1, and MUC5B. The LASSO regression
analysis [Figure 5A] results showed that the coefficients of these 10 genes in the regression model were all
non-zero; hence, all were retained. The final model was as follows:
98