
Page 103 - Read Online
P. 103
Li et al. Cancer Drug Resist. 2025;8:31 Page 9 of 26
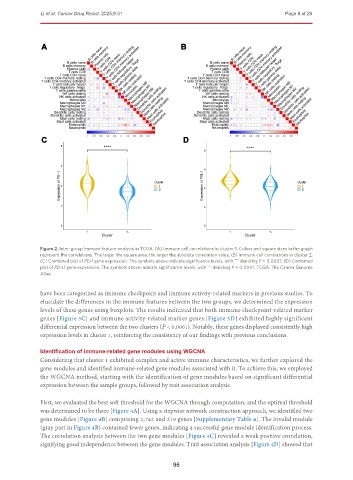
Figure 2. Inter-group immune feature analysis in TCGA. (A) Immune cell correlations in cluster 1. Colors and square sizes in the graph
represent the correlations. The larger the square area, the larger the absolute correlation value; (B) Immune cell correlations in cluster 2;
(C) Combined plot of PD-1 gene expression. The symbols above indicate significance levels, with denoting P < 0.0001; (D) Combined
****
plot of PD-L1 gene expression. The symbols above indicate significance levels, with denoting P < 0.0001. TCGA: The Cancer Genome
****
Atlas.
have been categorized as immune checkpoint and immune activity-related markers in previous studies. To
elucidate the differences in the immune features between the two groups, we determined the expression
levels of these genes using boxplots. The results indicated that both immune checkpoint-related marker
genes [Figure 3C] and immune activity-related marker genes [Figure 3D] exhibited highly significant
differential expression between the two clusters (P < 0.0001). Notably, these genes displayed consistently high
expression levels in cluster 1, reinforcing the consistency of our findings with previous conclusions.
Identification of immune-related gene modules using WGCNA
Considering that cluster 1 exhibited complex and active immune characteristics, we further explored the
gene modules and identified immune-related gene modules associated with it. To achieve this, we employed
the WGCNA method, starting with the identification of gene modules based on significant differential
expression between the sample groups, followed by trait association analysis.
First, we evaluated the best soft threshold for the WGCNA through computation, and the optimal threshold
was determined to be three [Figure 4A]. Using a stepwise network construction approach, we identified two
gene modules [Figure 4B] comprising 2,742 and 219 genes [Supplementary Table 4]. The invalid module
(gray part in Figure 4B) contained fewer genes, indicating a successful gene module identification process.
The correlation analysis between the two gene modules [Figure 4C] revealed a weak positive correlation,
signifying good independence between the gene modules. Trait association analysis [Figure 4D] showed that
96